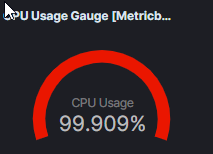
Cpu usage gauge uses the arithmetic operation as:
(Avg of system.cpu.user.pct + Avg of system.cpu.system.pct)/avg of system.cpu.cores that's why it is showing different values
Hi,
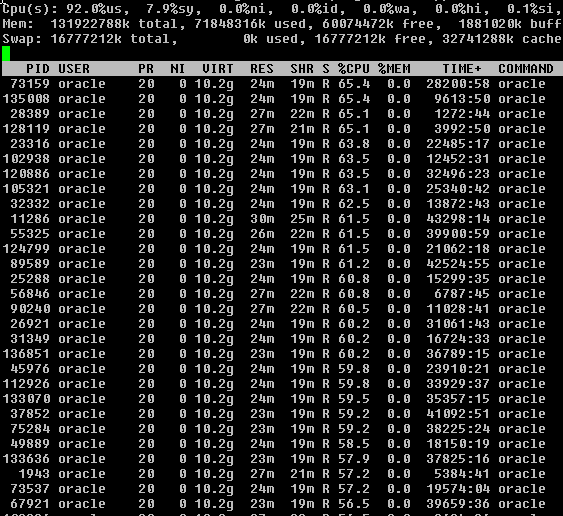
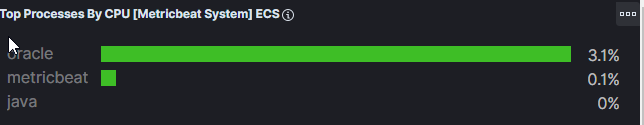
But the oracle process is consuming 70% of each core and that averages a total of 80% of all cores. So instead of showing the value of 3.1%, shouldn't it be 70%?
Apache, Apache Lucene, Apache Hadoop, Hadoop, HDFS and the yellow elephant
logo are trademarks of the
Apache Software Foundation
in the United States and/or other countries.