I have a multiple units numbered (1,2,3...) each unit has multiple type of log files(such as opereational, selinux audit, access & error)
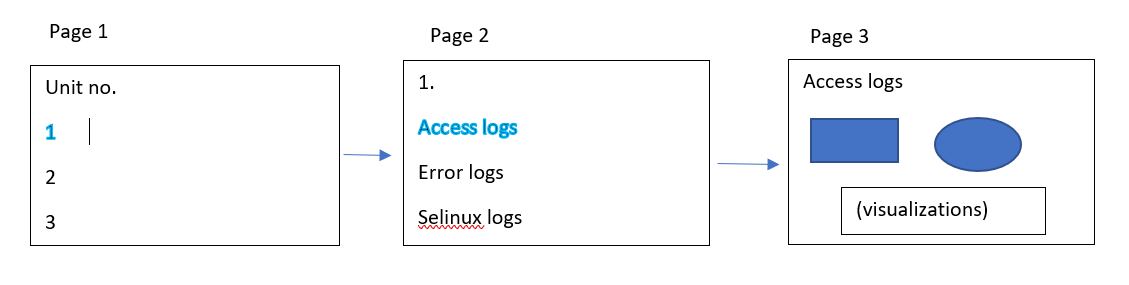
is it possible to create a UI on kibana that has a dashboard displaying all these unit numbers, further upon clicking on the number another dashboard should open displaying all the different type of log files which have their own dashboards.
example:
Sorry i am new to elk stack. would appreciate it if you could help me with another query. I have different type of log files such as audit, access, syslog, csv files belonging to each unit number. Do you recommend create different indices for each type or do i send all the data to one single index? will i be able to corelate the common field of "unit number" present in all the indices if i create multiple of them?
Apache, Apache Lucene, Apache Hadoop, Hadoop, HDFS and the yellow elephant
logo are trademarks of the
Apache Software Foundation
in the United States and/or other countries.