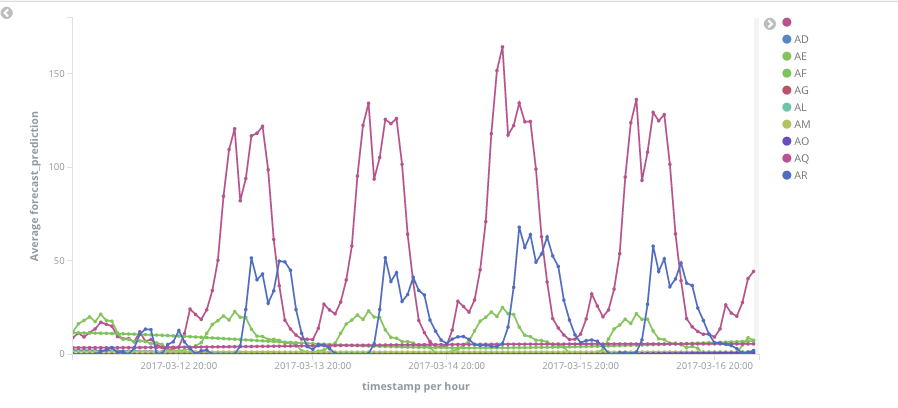
I would like to plot multiple job_id forecast predictions in a Basic Char Line, Currently i'm getting the forecast_prediction data with the following query in DevTools of Kibana:
GET .ml-anomalies-shared/_search
{
  "query": {
    "bool": {
      "filter": [
        {
          "query_string": {
            "query": "result_type:model_forecast"
          }
        },
        {
          "query_string": {
            "query": "job_id:peso-colombiano-2017"
          }
        }
      ]
    }
  }
}