It looks like your field is analyzed, elasticsearch is tokenizing your queries and then running an aggregation on the split up chunks. If you have a query.raw field available that should give you the results you want. If not, you'll want to setup a mapping that's not_analyzed for this field. See https://www.elastic.co/guide/en/elasticsearch/reference/current/mapping.html#_field_datatypes for more info.
If you don't have valuable data, the easiest option would be to delete all data available in your packetbeat-* index, and load the Packetbeat index template. In the newer versions of Packetbeat, the index template is loaded automatically at startup if it wasn't loaded before. What version of Packetbeat are you using?
Today I have deleted all my indices and reinstalled Kibana, ElasticSearch, and PacketBeat to the newest stable versions. And after this I have all new indices patterns with stars instead of "event times", like "packetbeat-*".
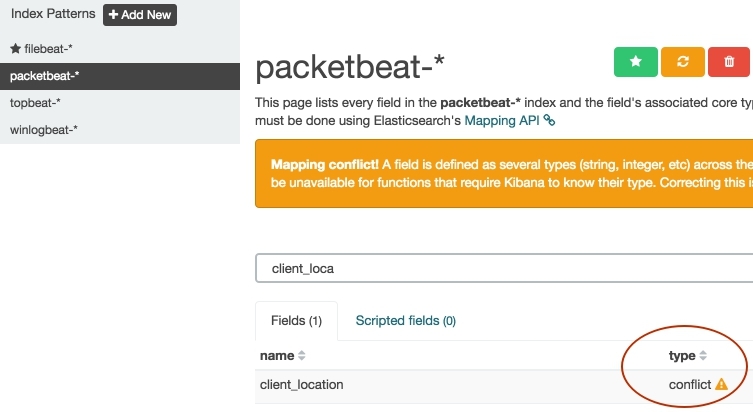
After reinstallation I have conflict mapping with the "client_location" field. Reindexing wasn't help. I have deleted all indices again and started from zero, but I still have the conflict mapping.
And in the MysqlDashboard I have the same problem with split queries. And yes, now the "query" field is real analysed.
Apache, Apache Lucene, Apache Hadoop, Hadoop, HDFS and the yellow elephant
logo are trademarks of the
Apache Software Foundation
in the United States and/or other countries.