Need help with elastic/kibana ESET connect integration

Hey people i am new to this forum, please help,

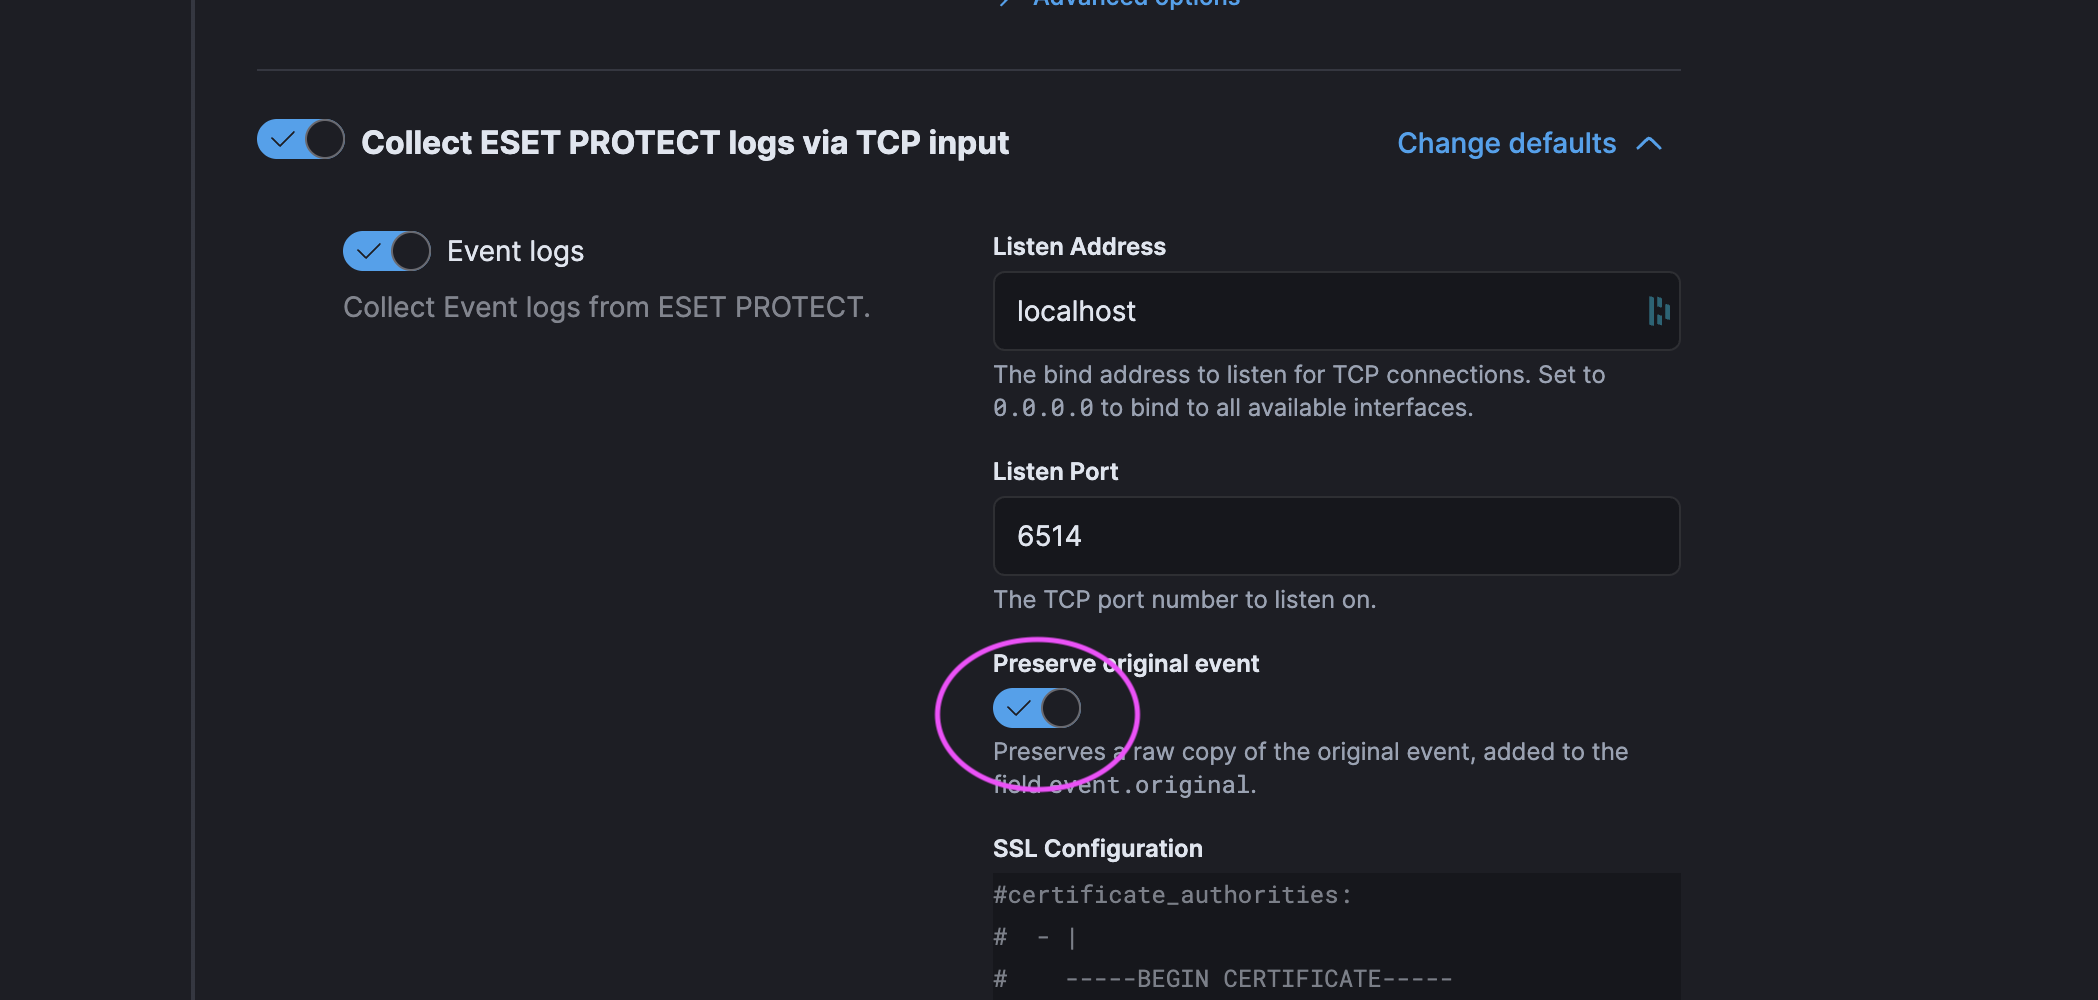
I have a problem with ESET integration, i connect it via TCP to collect JSON logs from it, my elastic/kibana is on-premis and ESET connect is a cloud one, so all is working but there an error you can see it on screen below

i have already wrote to ESET and they told me speak to Elastic

Hi @Sainar

Welcome to the community.

Looks like your events are failing parsing…

couple things

  1. Are you on the latest version of the integration I think it is 1.8.0

  2. What version of ESET protect are you using

Requirements

Elastic Agent must be installed. For more details, check the Elastic Agent installation instructions.

This module has been tested against the ESET PROTECT (version: 5.0.9.1).3Enable the preserve original event. Then go to one of the failed documents and get the JSON and share here (you can anonymize if needed, but if you change the structure/content we won't be able to help)

When you show us a sample document, please provide the entire document in JSON text, not a screenshot. We cannot debug screenshots. Anonymize what you need, but change the content as little as possible. In the example above, we can not even read the whole error… we cannot help with partial information.

  1. Did you make any changes to your ESET logging / event configs?
  2. You can see what sample data should look like
  1. Yes the integration in on latest level 1.8.0
  2. As i told before there no version it is ESET protect the cloud one
  3. yes i have done all this
{
  "_index": ".ds-logs-eset_protect.event-default-2025.06.26-000001",
  "_id": "S_Z86pcBjCbazTKePEfc",
  "_version": 1,
  "_source": {
    "input": {
      "type": "tcp"
    },
    "agent": {
      "name": "",
      "id": "44b1828a-2512-406e-81f3-29d742e53b8e",
      "type": "filebeat",
      "ephemeral_id": "975cf30f-6655-477f-9d9b-e5ba7867aede",
      "version": "8.18.3"
    },
    "@timestamp": "2025-07-08T14:41:30.051Z",
    "ecs": {
      "version": "8.11.0"
    },
    "log": {
      "source": {
        "address": ""
      }
    },
    "data_stream": {
      "namespace": "default",
      "type": "logs",
      "dataset": "eset_protect.event"
    },
    "elastic_agent": {
      "id": "44b1828a-2512-406e-81f3-29d742e53b8e",
      "version": "8.18.3",
      "snapshot": false
    },
    "event": {
      "agent_id_status": "verified",
      "ingested": "2025-07-08T14:41:40Z",
      "original": "\u0000\u0016\u0000\u0014\u0000\u001d\u0000\u0017\u0000\u001e\u0000\u0019\u0000\u0018\u0001\u0000\u0001\u0001\u0001\u0002\u0001\u0003\u0001\u0004\u0000#\u0000\u0000\u0000\u0005\u0000\u0005\u0001\u0000\u0000\u0000\u0000\u0000\u0016\u0000\u0000\u0000\u0017\u0000\u0000\u0000\r\u0000*\u0000(\u0004\u0003\u0005\u0003\u0006\u0003\b\u0007\b\b\b\t\b",
      "kind": [
        "alert",
        "pipeline_error"
      ],
      "dataset": "eset_protect.event"
    },
    "error": {
      "message": [
        "syslog failed to process field \"message\": parsing error at position 1: unexpected EOF",
        "Processor grok with tag grok_event_original in pipeline logs-eset_protect.event-1.8.0 failed with message: Provided Grok expressions do not match field value: [\u0000\u0016\u0000\u0014\u0000\u001d\u0000\u0017\u0000\u001e\u0000\u0019\u0000\u0018\u0001\u0000\u0001\u0001\u0001\u0002\u0001\u0003\u0001\u0004\u0000#\u0000\u0000\u0000\u0005\u0000\u0005\u0001\u0000\u0000\u0000\u0000\u0000\u0016\u0000\u0000\u0000\u0017\u0000\u0000\u0000\r\u0000*\u0000(\u0004\u0003\u0005\u0003\u0006\u0003\b\u0007\b\b\b\t\b]"
      ]
    },
    "tags": [
      "preserve_original_event",
      "forwarded",
      "eset_protect-event"
    ],
    "eset_protect": {
      "event": {
        "is_handled": false
      }
    }
  },
  "fields": {
    "elastic_agent.version": [
      "8.18.3"
    ],
    "agent.type": [
      "filebeat"
    ],
    "event.module": [
      "eset_protect"
    ],
    "agent.name.text": [
      ""
    ],
    "agent.name": [
      ""
    ],
    "elastic_agent.snapshot": [
      false
    ],
    "eset_protect.event.is_handled": [
      false
    ],
    "event.agent_id_status": [
      "verified"
    ],
    "event.kind": [
      "alert",
      "pipeline_error"
    ],
    "event.original": [
      "\u0000\u0016\u0000\u0014\u0000\u001d\u0000\u0017\u0000\u001e\u0000\u0019\u0000\u0018\u0001\u0000\u0001\u0001\u0001\u0002\u0001\u0003\u0001\u0004\u0000#\u0000\u0000\u0000\u0005\u0000\u0005\u0001\u0000\u0000\u0000\u0000\u0000\u0016\u0000\u0000\u0000\u0017\u0000\u0000\u0000\r\u0000*\u0000(\u0004\u0003\u0005\u0003\u0006\u0003\b\u0007\b\b\b\t\b"
    ],
    "elastic_agent.id": [
      "44b1828a-2512-406e-81f3-29d742e53b8e"
    ],
    "data_stream.namespace": [
      "default"
    ],
    "input.type": [
      "tcp"
    ],
    "data_stream.type": [
      "logs"
    ],
    "tags": [
      "preserve_original_event",
      "forwarded",
      "eset_protect-event"
    ],
    "event.ingested": [
      "2025-07-08T14:41:40.000Z"
    ],
    "@timestamp": [
      "2025-07-08T14:41:30.051Z"
    ],
    "agent.id": [
      "44b1828a-2512-406e-81f3-29d742e53b8e"
    ],
    "ecs.version": [
      "8.11.0"
    ],
    "error.message": [
      "syslog failed to process field \"message\": parsing error at position 1: unexpected EOF",
      "Processor grok with tag grok_event_original in pipeline logs-eset_protect.event-1.8.0 failed with message: Provided Grok expressions do not match field value: [\u0000\u0016\u0000\u0014\u0000\u001d\u0000\u0017\u0000\u001e\u0000\u0019\u0000\u0018\u0001\u0000\u0001\u0001\u0001\u0002\u0001\u0003\u0001\u0004\u0000#\u0000\u0000\u0000\u0005\u0000\u0005\u0001\u0000\u0000\u0000\u0000\u0000\u0016\u0000\u0000\u0000\u0017\u0000\u0000\u0000\r\u0000*\u0000(\u0004\u0003\u0005\u0003\u0006\u0003\b\u0007\b\b\b\t\b]"
    ],
    "log.source.address": [
      ""
    ],
    "data_stream.dataset": [
      "eset_protect.event"
    ],
    "agent.ephemeral_id": [
      "975cf30f-6655-477f-9d9b-e5ba7867aede"
    ],
    "agent.version": [
      "8.18.3"
    ],
    "event.dataset": [
      "eset_protect.event"
    ]
  }
}

How is your input configured? Can you share it? Redact sensitive information.

It looks like that ESET is sending you dat with TLS/SSL, but your input is not configured to receive data using TLS/SSL.

Please be polite, we sometimes ask for clarification.
Protect Cloud is not explicitly listed as supported, only on-premises as far as I can see. That is not to say this will not work, but it may require some work.

Is this what you are following?

This is unicode of mostly non-printable characters… not a valid message at all
Are there other original Events you can share that look more normal?
If so can you share?

Can you try the following?

max_message_size: 8KiB
encoding: utf-8

Ohh I just saw this are you adding the CA?

If So you need to uncomment that first line…

1 Like

Thanks people i think i understood the problem, on ESET the SSL is activated and on Elastic/kibana not. I think the data will come, if not i will write again.

thanks again and be safe

1 Like

Hey people once again i need your help with this topic, i don't know maybe i need to create a new one! please help. or we can connect somehow, and you will help me
i don`t understand what should i do next, as you remember this is my integration config

what should i do next? and from this cert come from?

No lets keep it here…

And to clarify, this is a public forum; we do not engage directly with community members.

So if you are following this… are you?

.Destination IP or FQDN of TLS-compatible syslog server—IPv4 address or hostname of the destination for Syslog messages and port drop-down menu for Syslog messages.

f.Validate CA Root certificates of TLS connections—Click the toggle to enable the certificate validation for the connection between your Syslog server and ESET PROTECT. After enabling the validation, a new text field will be displayed where you can copy and paste the required certificate chain. The server certificate must meet the following requirements:

Have you tried to toggle off the certificate validation, as mentioned above in the ESET syslog output?

Then, remove the certificate from the integration, everything you have circled from above.

lets add

enabled: true in that section though, it should be on by default but just to make sure

Note
After making the applicable changes, click Apply settings. The configuration becomes effective in 10 minutes.

Try that and report back…

And when you report back please provide detail what is not working… sample message

You can also go to discover and filter on

data_stream.dataset : "elastic_agent.filebeat"

or

data_stream.dataset : "elastic_agent.filebeat" and host.name: "thehostnameoftheagenet”

And look at the messages there… you should see some error messages

Hey people i have an error like this when i enabled SSL on both sides so here is the error screen:


and down below is my elastic-agent config:

inputs:
  # Collect ESET PROTECT logs via TCP input: Collecting logs from ESET PROTECT via TCP input.
  - id: eset_protect-tcp
    type: tcp
    streams:
      # Event logs: Collect Event logs from ESET PROTECT.
      - id: tcp-eset_protect.event
        data_stream:
          dataset: eset_protect.event
          type: logs
        host: 'localhost:6514'
        #max_message_size: 200KiB
        ssl.enabled: true
        ssl.certificate: /opt/certs/server/server.crt
        ssl.key: /opt/certs/server/server.key
        ssl.certificate_authorities: ["/opt/certs/server/rootCA.pem"]
        ssl.verification_mode: certificate
        tags:
          - preserve_original_event
          - preserve_duplicate_custom_fields
          - forwarded
          - eset_protect-event
        publisher_pipeline.disable_host: true
        processors:
          - syslog:
              field: message

i am confused really i dont know where the error is, i have generated all certs as it was written in esset guide and still i have and error above.

Hi @Sainar I / we are confused too...

We may need to help but I / we will need you to answer and do a few things

Are you configuring the Agent
A) through Fleet / Integration (The UI?) or
B) are you trying Standalone Agent (manual) install? it is unclear
Which One.. it is unclear this is Key for use to help

To Help Debug

Also as suggested, if we want to see the actual errors

Go to discover and filter on the following in the KQL bard

data_stream.dataset : "elastic_agent.filebeat"

or

data_stream.dataset : "elastic_agent.filebeat" and host.name: "thehostnameoftheagenet”

And look at the messages there… you should see some error messages

There will be more detailed logs there

Also you can run the

the elastic-agent inspect or elastic-agent inspect components --show-config

Perhaps that is what you are showing above?

and elastic-agent status commands

Yes, i am configuring agent through Fleet/Integration (The UI) not standalone.
Here is the error from elastic-agent status

 elastic-agent status
┌─ fleet
│  └─ status: (HEALTHY) Connected
└─ elastic-agent
   ├─ status: (DEGRADED) 1 or more components/units in a failed state
   └─ tcp-default
      ├─ status: (HEALTHY) Healthy: communicating with pid '30749'
      └─ tcp-default-tcp-eset_protect-8be6a3a4-d5e0-46a2-ab1b-594019027845
         └─ status: (FAILED) certificate file not configured accessing 'ssl'

from here data_stream.dataset : "elastic_agent.filebeat" and host.name: "thehostnameoftheagenet” i see no errors
this is all i can provide

Then I am not sure if we can help then... perhaps I am missunderstanding...

From discovery... you ran this with time frame going back a few hours?... show me... exactly what you did ... because there must be agent logs... if not then the agent may not be connecting with Elasticsearch at all.

Are you getting the system logs and system metrics from this agent?
It is unclear whether the error originates from the ESET integration or another source.

Are you getting any telemetry at all from this agent... lets back up...

Take out the ESET and turn on system metrics and logs... and let see if that works

Also Show me a Screen Shot of the ssl section of the inegration...

People you won't believe but i solve problem through chat GPT it says when in elastic-agent configuration fleet:enabled: true it overrides all inputs so the configuration must be done in ESET integration in Kibana so here is a screen shot of integration configuration:


As you see ssl config is in Custom TCP Options and the error disappeared making elastic-agent status HEATHY.

Thaks for your help that was really productive to me to know a little more about Elastic/Kibana

Hi @Sainar
Gkad and you got it working and sharing your solution.

Question: were you trying to edit the configuration manually on the agent host not through the integration? If so ... Yeah that won't work :wink:

That's why I asked earlier if you were trying to do stand-alone or fleet managed...

Super glad you got it working and thanks for sharing your solution.