Nginx access and error logs show incorroct value in kibana dashboard

I am new in ELK. I have ELK stack 7.12.0 (filebeat -> logstash -> elasticsearch cluster -> kibana)
I installed filebeat on nginx server and enabled nginx module. these are my configuration files:

filebeat.yml

    filebeat.inputs:
    - type: log
      enabled: true
      paths:
        - /var/log/*.log

    filebeat.config.modules:
      path: ${path.config}/modules.d/*.yml
      reload.enabled: false

    setup.template.settings:
      index.number_of_shards: 1

    setup.kibana:
      host: "x.x.x.x:5601"

    output.logstash:
      hosts: ["y.y.y.y:5044"]

    processors:
      - add_host_metadata:
          when.not.contains.tags: forwarded
      - add_cloud_metadata: ~
      - add_docker_metadata: ~
      - add_kubernetes_metadata: ~

filebeat/modules.d/nginx.yml


    - module: nginx
      access :
        enabled: true
        var.paths: ["/var/log/nginx/access.log"]

      # Error logs
      error:
        enabled: true
        var.paths: ["/var/log/nginx/error.log"]


kibana discovery shows corroct data:

But in dashboard access graph has no data and error graph shows access data!!!!!

what is your idea?

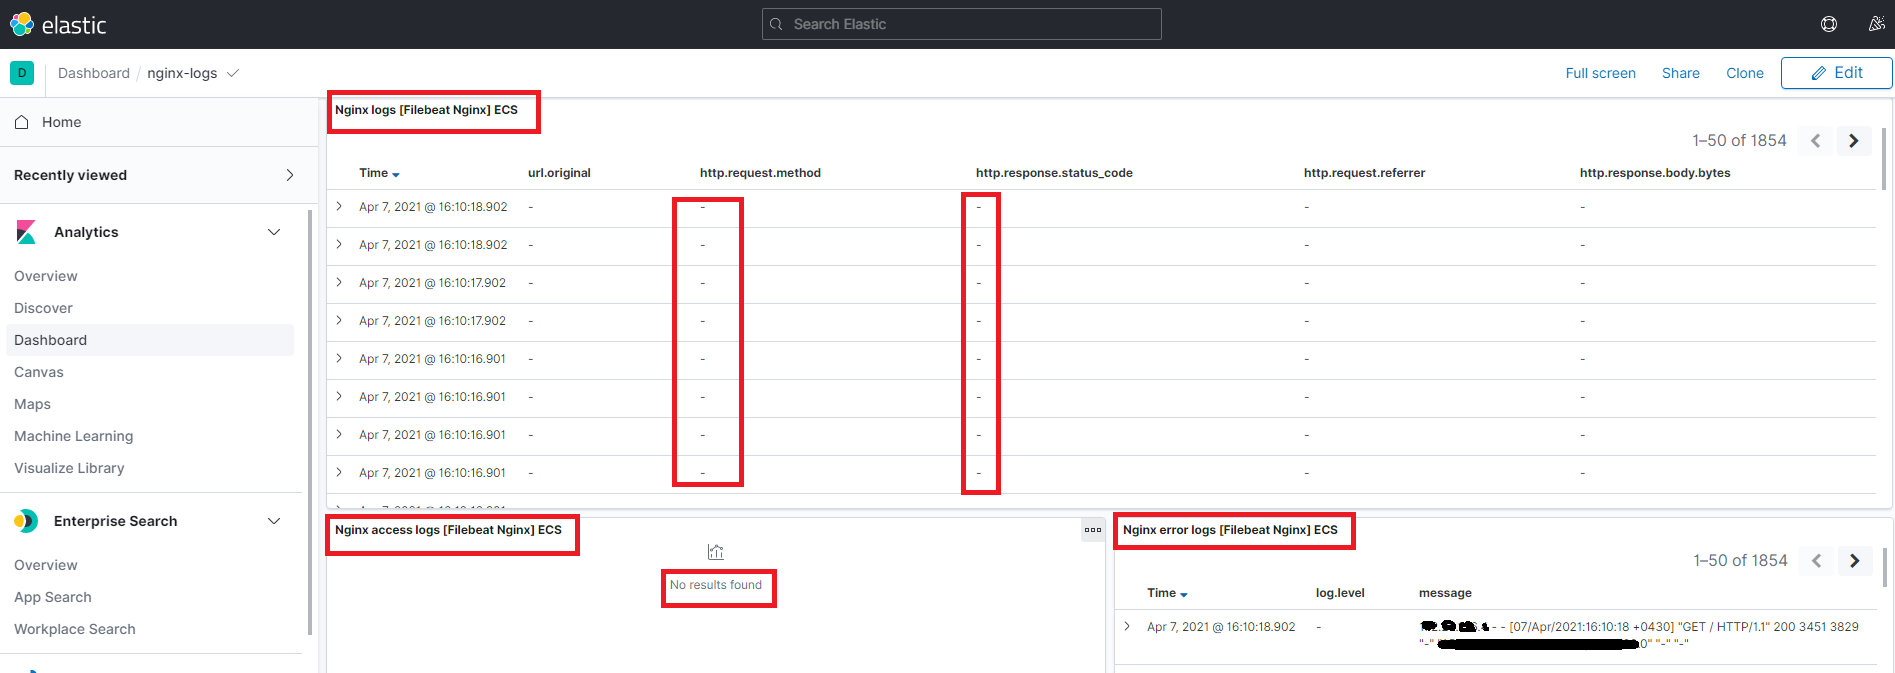
It looks like the Filebeat Nginx module is not parsing the access logs correctly at ingest time -- so when the document is ingested into Elasticsearch, the entire line is showing up in the "message" field, and the other fields are not populated.

The Filebeat Nginx module documentation states that it has been tested with Nginx version 1.10. What version of Nginx are you using? Also, can you share a sample of a few lines from your Nginx access log here?

Did you run

filebeat setup -e

Or did you just load the dashboards?

Yes, I did it.

nginx version: nginx/1.16.1

And this is the sample of my nginx access log:

Can you please share your logstash pipeline.

/etc/logstash/conf.d/02-beats-input.conf

    input {
      beats {
        host => "0.0.0.0"
        port => "5044"
      }
    }

/etc/logstash/conf.d/30-elasticsearch-output.conf

output {
  elasticsearch {
    hosts => ["http://X.X.X.X:9200"]
    manage_template => false
    index => "%{[@metadata][beat]}-%{[@metadata][version]}-%{+YYYY.MM.dd}"
  }
}

And I dont have filtering pipeline.

Here is my beats -> logstash - es conf

Pay special attention the the pipeline reference, what is probably happening is the the ingest pipeline (the ngnix ingest pipeline) is not being called, thus the logs are not parse correctly

If you first point filebeat at elasticsearch and run
filebeat setup -e

Then point filebeat to logstash and use this all the ILM, Templates, Pipelines, dashboards etc should work.

################################################
# beats->logstash->es default config.
################################################
input {
  beats {
    port => 5044
  }
}

output {
  if [@metadata][pipeline] {
    elasticsearch {
      hosts => "http://localhost:9200"
      manage_template => false
      index => "%{[@metadata][beat]}-%{[@metadata][version]}"
      pipeline => "%{[@metadata][pipeline]}" 
      user => "elastic"
      password => "secret"
    }
  } else {
    elasticsearch {
      hosts => "http://localhost:9200"
      manage_template => false
      index => "%{[@metadata][beat]}-%{[@metadata][version]}"
      user => "elastic"
      password => "secret"
    }
  }
}

Thank you @stephenb.
I run this command to load template:

filebeat setup --dashboards

After that I run this command and output was ok:

 filebeat setup --index-management -E output.logstash.enabled=false -E 'output.elasticsearch.hosts=["X.X.X.X:9200"]'

After some changes, Now I get this error when I run again filebeat setup -e:

2021-04-10T11:03:38.921+0430    WARN    beater/filebeat.go:178  Filebeat is unable to load the Ingest Node pipelines for the configured modules because the Elasticsearch output is not configured/enabled. If you have already loaded the Ingest Node pipelines or are using Logstash pipelines, you can ignore this warning.
2021-04-10T11:03:38.921+0430    ERROR   instance/beat.go:971    Exiting: Index management requested but the Elasticsearch output is not configured/enabled
Exiting: Index management requested but the Elasticsearch output is not configured/enabled

I am new. May I ask you help me what should I do step by step to troubleshot or send me some links to study?
I would be appreciated you.

Hi @fati

I provided my suggestion... But looks like you are still trying other options.

You are making this more complex than it needs to be. You are trying to run set up with all the individual commands that can often lead to issues as opposed to just running the basic command that I supplied so let's try this again.

  1. go into elasticsearch and clean up / delete any filebeat indices

  2. in your filebeat.yml configure the output to point to elasticsearch. Comment out the logstash output. The kibana setup looks good.

  3. run this command no extra parameters just this command. This will set up everything

filebeat setup -e

If you're running 7. 12 there's actually a little bug and it'll throw some errors at the bottom of that command but it should be fine ignore them for now.

  1. now go back into your filebeat.yml and comment out (or take out) the elasticsearch output and put in your logstash output.

  2. use the logstash configuration file that I provided above and start logstash.

  3. start filebeat with no extra paramaters

filebeat -e

Perhaps I didn't provide enough information there is an nginx pipeline that's automatically loaded and is used to parse the data on the elasticsearch side if you don't configure all this correctly like I showed above that will not be used and therefore your data will not be processed and therefore the dashboards will not work.

Please try my suggestions and then if they don't work we can take another look I have set this up many times exactly like this for nginx logs and I can load the dashboards and everything.

thank you for helping @stephenb.
I did exactly 0-5 step by step as you said, but unfortunately the same result.

Hmmmm ... Bummer. :frowning:

What version

Are there any errors? from Filebeat or Logstash?

Can you try to send the data directly from filebeat to elasticsearch just to test? (skip logstash) I suspect if you when filebeart -> Elasticsearch it would work.

Can you share what the nginix documents looks like in elasticsearch?

GET filebeat-*/_search

Can you show

GET _cat/indices/filebeat*/?v

Also curious why you have this, are there other logs beside nginx logs?

    filebeat.inputs:
    - type: log
      enabled: true
      paths:
        - /var/log/*.log

Also I just realized somethings I may have found it!!

What other conf files do you have in /etc/logstash/conf.d/

Please do a

ls -l /etc/logstash/conf.d/

And show that results... All conf files in that directory are concatenated together so if you have other conf files they may be interfering, we have see that before....

If you want separate pipelines you define them in the pipelines.yml

1- I have 5 node ELK stack 7.12.0 (filebeat -> logstash -> elasticsearch cluster -> kibana)

elasticsearch = 3 node
logstash = 1 node
kibana = 1 node

2- I will try to skip logstash and will feedback and I think it can be the problem.

3- GET filebeat-*/_search output:

woooow, I don't have any ouput for /var/log/nginx as log path. I have only /var/log/messages.

4- GET _cat/indices/filebeat*/?v

health status index                             uuid                   pri rep docs.count docs.deleted store.size pri.store.size
green  open   filebeat-7.12.0-2021.04.11-000001 2KoY1dA6TiqL4ShZoS8GfA   1   1      28928            0     11.1mb          5.5mb

5- Yes, I gather other logs too.

6- ls -l /etc/logstash/conf.d/

-rw-r--r-- 1 root root  65 Apr  6 10:49 02-beats-input.conf
-rw-r--r-- 1 root root 423 Apr 11 07:31 30-elasticsearch-output.conf

There isn't any pipelines.yml file in logstash server. Should I create it?

After I change two pipeline to one, the same result again:
ls -l /etc/logstash/conf.d/

-rw-r--r-- 1 root root 488 Apr 13 08:13 sample.conf

Great info thanks... We will figure this out

This is telling.... ^^^^ it looks like filebeat is not harvesting the ngnix logs.

On the filebeat server with ngnix logs....

ls -l /var/log/ngnix

What do you see?

I think you maybe missing a wildcard, let's look at that directory.

Perhaps it should be

var.paths: ["/var/log/nginx/access.log*"]

Also I would keep it as one Logstash conf file for now, use the ones I gave you... and you don't need a pipeline file for now that's advanced let's figure this out.

ls -l /var/log/nginx/

-rw-rw-r--. 1 nginx root 18510741 Apr 13 10:30 access.log
-rw-rw-r--. 1 nginx root  2472025 Apr  4 03:50 access.log-20210404.gz
-rw-rw-r--. 1 nginx root  3482714 Apr  5 03:26 access.log-20210405.gz
-rw-rw-r--. 1 nginx root  2884830 Apr  6 03:15 access.log-20210406.gz
-rw-rw-r--. 1 nginx root  2589581 Apr  7 03:40 access.log-20210407.gz
-rw-rw-r--. 1 nginx root  2420657 Apr  8 03:38 access.log-20210408.gz
-rw-rw-r--. 1 nginx root  2153234 Apr  9 03:39 access.log-20210409.gz
-rw-rw-r--. 1 nginx root  2347481 Apr 10 03:49 access.log-20210410.gz
-rw-rw-r--. 1 nginx root  3130244 Apr 11 03:31 access.log-20210411.gz
-rw-rw-r--. 1 nginx root  2950443 Apr 12 03:41 access.log-20210412.gz
-rw-rw-r--. 1 nginx root  2875005 Apr 13 03:14 access.log-20210413.gz
-rw-rw-r--. 1 nginx root   974454 Apr 13 10:30 error.log
-rw-rw-r--. 1 nginx root   131459 Apr  4 03:50 error.log-20210404.gz
-rw-rw-r--. 1 nginx root   135832 Apr  5 03:26 error.log-20210405.gz
-rw-rw-r--. 1 nginx root   136562 Apr  6 03:15 error.log-20210406.gz
-rw-rw-r--. 1 nginx root   139024 Apr  7 03:40 error.log-20210407.gz
-rw-rw-r--. 1 nginx root   139061 Apr  8 03:38 error.log-20210408.gz
-rw-rw-r--. 1 nginx root   139941 Apr  9 03:39 error.log-20210409.gz
-rw-rw-r--. 1 nginx root   140517 Apr 10 03:49 error.log-20210410.gz
-rw-rw-r--. 1 nginx root   138689 Apr 11 03:31 error.log-20210411.gz
-rw-rw-r--. 1 nginx root   141629 Apr 12 03:41 error.log-20210412.gz
-rw-rw-r--. 1 nginx root   138111 Apr 13 03:14 error.log-20210413.gz
-rw-r--r--. 1 root  root  4495573 May  2  2020 s3.access
-rw-r--r--. 1 root  root  1653323 May  2  2020 s3.error

I just enable filebeat nginx module:

 filebeat modules list
Enabled:
nginx

I change path in nginx.yml as you said:

var.paths: ["/var/log/nginx/access.log*"]
var.paths: ["/var/log/nginx/error.log*"]

in filebeat.yml :

paths:
    - /var/log/nginx/*

ls -l /etc/logstash/conf.d

-rw-r--r-- 1 root root 488 Apr 13 08:13 sample.conf

now when I run GET filebeat-*/_search the result shows correct paths.

but still the same result.
I think the problem is filebeat module and it doesn't work.

Ok I am willing to keep working if you are...

Perhaps but this module is used by many people if it wasn't working we would be getting a lot of reports. ... but it may not be working for you, lets figure it out.

I think there is 1 of 2 things...

  1. The config is not correct

  2. Or perhaps your ngnix logs have been modified and they are not standard.

First Important do not configure the ngnix path in the filebeat.yml only the ngnix.yml not both.

var.paths: ["/var/log/nginx/access.log*"]
var.paths: ["/var/log/nginx/error.log*"]

in filebeat.yml : <!---- TAKE this out... this is overiding the module.... and thus not parsing the logs

paths:
    - /var/log/nginx/*

In fact please disable that input entirely while we debug ... take out or set to false

    filebeat.inputs:
    - type: log
      enabled: false <!----- HERE or take out entirely
      paths:
        - /var/log/*.log

Request : Can you provide 3 sample ngnix raw log lines I want to make sure they parse correctly.
You can anonymize the IPs if you wish.

Now can also try directly from Filebeat -> Elasticsearch (with only the ngnix module enabled)

  1. You will need to clean up the filebeat registry so it will reload the files, you do this by removing the data directory in filebeat. The side effect of this is it will reload all the logs... if you are ok.
    so from inside the filebeat directory...

rm -fr ./data

  1. Now comment out the logstash output in the filebeat.yml and configuration

  2. Run filebeat and take a look.

2 Likes

@stephenb Kudos mate! :clap: :1st_place_medal:

@stephenb Sure, I will be gratefull.

tail -n 3 /var/log/nginx/access.log

X.X.X.X - - [14/Apr/2021:12:51:48 +0430] "HEAD /test2/ HTTP/1.1" 403 0 392 "-" "APN/1.0 VVVV/1.0 XXXXX/20.0" "-" "-"
Y.Y.Y.Y - - [14/Apr/2021:12:51:48 +0430] "GET / HTTP/1.1" 200 3451 3829 "-" "APN/1.0 VVVV/1.0 XXXXX/20.0" "-" "-"
Z.Z.Z.Z - - [14/Apr/2021:12:51:48 +0430] "HEAD /test1/ HTTP/1.1" 200 0 399 "-" "APN/1.0 VVVVV/1.0 XXXXXX/20.0" "-" "-" 

tail -n 3 /var/log/nginx/error.log

2021/04/14 12:58:20 [error] 25577#0: *8167958 access forbidden by rule, client: X.X.X.X, server: *......., request: "GET /status/format/json HTTP/1.1", host: "Y.Y.Y.Y"
2021/04/14 12:58:25 [error] 25578#0: *8167983 access forbidden by rule, client: X.X.X.X, server: *.........., request: "GET /status/format/json HTTP/1.1", host: "Y.Y.Y.Y"
2021/04/14 12:58:30 [error] 25577#0: *8167992 access forbidden by rule, client: X.X.X.X, server: *......., request: "GET /status/format/json HTTP/1.1", host: "Y.Y.Y.Y"

I tried your solution and strangely as same as result.

I try to make my own dashboard but the most fields
are empty.

Well that explains it! :slight_smile:

Those are custom log formats ... not standard / default format that is why the logs are not getting parsed, I should have looked at that earlier.

I did ask for this and never got it... that is why I asked... that would have shortened this, I should have re-asked... it is why I ask certain question... my fault.

You have 3 numbers in the sequence, the default has 2

So first we need to find out what they are. You need to talk to the ngnix team and find out what their log format is. What are the other 2 numbers other than status_code, 1 is mostly likely response.body.bytes,
which is the other? and what order are they in.
200 3451 3829

It looks like the error logs have the same issue.

The default format has 2 fields, example
200 43707

Which get parsed into.

http.response.status_code: 200
http.response.body.bytes: 43707

If you look at your documents in elastic you should see something like

    "error": {
      "message": "Provided Grok expressions do not match field value: [127.0.0.1 - - [14/Apr/2021:12:51:48 +0430] \\\"HEAD /test1/ HTTP/1.1\\\" 200 0 399 \\\"-\\\" \\\"APN/1.0 VVVVV/1.0 XXXXXX/20.0\\\" \\\"-\\\" \\\"-\\\"]"

Once you figure out what the formats are we can think about how to fix, so go find out.

Just for reference here is a default logs format

127.0.0.1 - - [13/Apr/2021:00:00:04 +0000] "GET / HTTP/1.1" 200 43707 "https://www.elastic.co/" "Mozilla/5.0 (compatible; MSIE 10.0; Windows NT 6.1; Trident/5.0)"

(note http.response.status_code and http.response.body.bytes)

1 Like