No nginx metric graphs

Hi. I have installed metricbeat on the Nginx server to send the data to the ELK server. I have loaded the dashboards but no data appears in the graphs.
The version used by Metricbeat and ELK is 1.10.1 and Nginx is 1.16.1.

The nginx module file:

I followed the next guide: Cómo monitorear los servidores web NGINX con el Elastic Stack | Elastic Blog

Can you do me a favor and run this in the Developer console in Kibana?

GET _cat/indices

Are there any results that show up in Discover? For those built in Dashboards, there should already be an index pattern that matches metricbeat-*

Hi Simianhacker,

This is the result in the Dev console:


The line 21 shows "yellow open metricbeat-2021.02"

System Dashboard works but Nginx Dashboard not.

Regards.

Let's see if there is any Nginx data by running this query:

POST metricbeat-*/_search
{
  "size": 0, 
  "query": {
    "bool": {
      "filter": [
        {
          "range": {
            "@timestamp": {
               "gte": "now-15m",
                "lte": "now"
            }
          }
        },
        {
          "match_phrase": {
            "event.module": "nginx"
          }
        }
      ]
    }
  }
}

Then look at the hits.total.value path, it should not be zero.

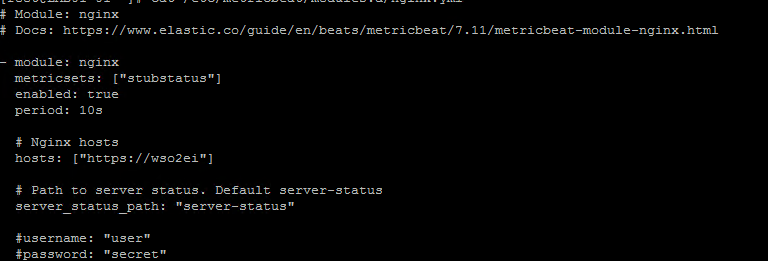
Can you log into one of the servers and try making a curl request using the combination of values from the hosts setting and server_status_path? So for the configuration you posted, log on to the same machine and run:

curl -k -XGET https://wso2ei/server-status

Finally, are there any logs form the Metricbeat process? Or can you run it live on the machine adding the -e flag like so: ./metricbeat -e. That command will spit out the logs to the console and make it easier to debug.

You are right, hits.total.value path is not 0.

{
"took" : 0,
"timed_out" : false,
"_shards" : {
"total" : 4,
"successful" : 4,
"skipped" : 0,
"failed" : 0
},
"hits" : {
"total" : {
"value" : 90,
"relation" : "eq"
},
"max_score" : null,
"hits" :
}
}

I did some changes in Nginx and that all traffic is balanced to /carbon/admin/login.jsp. So I changed the module file.

curl output:
image

The command metricbeat run -e doesn't show any error.

I resolved the issue. I added allow all in nginx.conf in the location /nginx_status
image

Then I changed again the nginx module file to server_status_path : "/nginx_status" and reload both services.
image
image

Thanks.

This topic was automatically closed 28 days after the last reply. New replies are no longer allowed.