Hi All,
I am new to ELK. i have log file which contains response time (numeric). ,groupid (numeric) ,and transaction id (eg AB0989). I have extracted them using grok pattern::
%{NUMBER:RESTIME:INT} %{NUMBER:GROUPID:INT}
%{USERNAME:TRANSACTIONID}
and when i run this pattern in Grok Debugger It will segregate the Data in Listed format
RESTIME :10010ms
GROUPID :1000
TRANSACTIONID: AB0989,
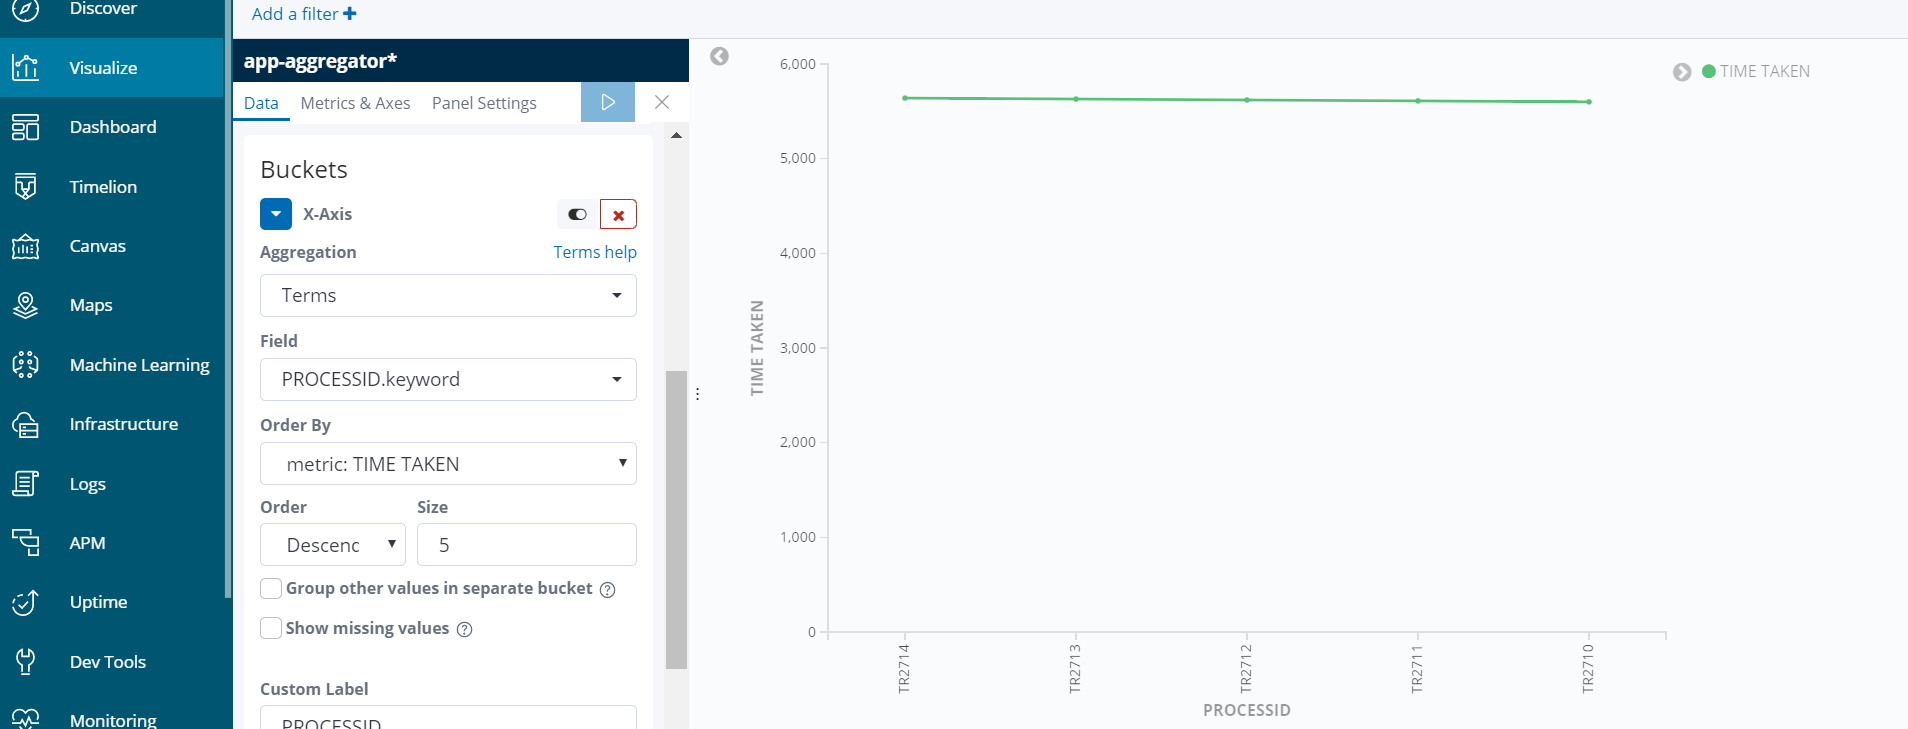
but when i try to show them using RESTIME (showing on Y - AXIX and using average metrics) and TRANSIACTIONID(showing on X-AXIX and using TERM (DESCENDING /ASCENDING) it is only showing top five values.
In log file RESTIME AND TRANSACTIONID are changing in real time and it is also updating on discover page , but in line-chart visualization it showing top five values.
Can you please suggest or point out the mistakes .
It will be very helpful .
Regards,
Shivam

Hi Nickpeihl,
Thanks for your reply,
Yes it is only showing top five values(but Not in the order they are getting logged)
PROCESSID FIELD is unique and it is updating every second and Response time is random, but my graph is only picking top 5 maximum Response Time and not showing the value which is less than those previous top or maximum 5 value.
But if the Response Time is greater than previous value than it is updating in real time .
I need to show this data in real time .
Not able to find the mistakes or i am missing something?
Regards,
Shivam
Can you share a screenshot? I'm having trouble understanding the issue.
Hi Nickpeihl,
Thank You For your support,
Please accept my apology for replying this late.
I have uploaded screenshot of logstash conf. file and sample of log file ( where log is getting stored) and line
chart visualization (X_AXIX AND Y _AXIX) on kibana dashboard.
1)As you can see in sample log that my log's are updating in real time but in line chart it is only showing top five value( it is only showing the maximum value , but I want to show the log in real time as my log file is getting logged )
- Also I have two type of trans code one is 3000 and another one is 4000 (Please refer sample log file) , but in line chart it is updating values for 4000 only( not in real time but the higher one).


I hope now you will be able to understand the scenario .
Regards,
Shivam
Thank you. I believe I understand now. The closest we can provide to realtime visualization in Kibana is by configuring the Auto-Refresh setting in your Visualization or Dashboard. https://www.elastic.co/guide/en/kibana/7.3/autorefresh.html
This will query the Elasticsearch database and refresh the visualization at each interval you select.
Of course, there may be a slight delay between when the data is sent by Logstash, when the index is refreshed in Elasticsearch (typically every second), and when the query results are received by Kibana. So you could expect a delay of a few seconds.
Hi Nickpeihl,
Thank you for your reply and help.
My concern is that my log's are getting update on discover page as they are getting logged in log file( in same order also) (Auto-Refresh is set to 5 seconds), but on visualization in line-chart it is showing top 5 maximum value (Please refer log file and line chart for clear picture).
As you can see in log file that last log are TR2506(response time :: 3560) and QR156( response time is ::1060) but in visualization it is showing TR2714 (response time :: 5640) to TR2710(response time :: 5600 ) as last process id ,so you can see that my logs are not getting update as they are on discover page and log file.
So my question is How i can show this types of log in real time (Refresh time is not concern , but they must get updated in the order they are getting logged)?
Also right now i have two Group TR(4000 is group id) and QR(3000 is group id) , but as you can see in visualization only (Process id starting with TR whose group id is 4000) is showing (I have not applied any filters).
{ Second approach --->> Also I have tried applying filters for both group and tried to show them in different chart but i face the same problem (showing top values only), as they don't show the real time data }
**One temporary solution that i have applied (but can't make it permanent) ::
If I make my ProcessId(ex-TR2714 and QR156) in numeric (for ex- 2714 & 156)
then using histogram i am able to show them in real time but in two different chart for two different group(which is not ideal) and they are getting updated as they are on discover page and in log file .
But can't make Process Id in numeric because it will get conflict with other Group(for 3000 & 4000) and it will be very difficult to identify to which group they belong to.
I hope i am able to give you the full scenario .
Regards,
Shivam