I have a canvas visualisation made of a SQL query to count clicks on a site. This is some very high numbers.
Can I format the column so instead of "100000" and "75000", it will be shown as "100.000" and "75.000"?

I have a canvas visualisation made of a SQL query to count clicks on a site. This is some very high numbers.
Can I format the column so instead of "100000" and "75000", it will be shown as "100.000" and "75.000"?
Hi @_Louw you can do this with the formatNumber function in the expression.
Hi @tims, I'm not quite sure on the syntax used here. I tried inserting "label={formatnumber "0.0a"}" in my code, but it doesn't work. Can you advise on what I'm doing wrong? I inserted it just before the "font" block like in the example.
Below is my code
filters
| timefilter column="datetime_" from="now-14d" to="now+1h"
| essql
query="SELECT HISTOGRAM(datetime_  + INTERVAL 1 HOUR, INTERVAL 1 DAY) as dag,
COUNT(reference_) as logins FROM \"[indexpattern]\" GROUP BY dag"
| alterColumn column="dag" type="date"
| mapColumn name="formatted_dag" fn={getCell "dag" | formatdate "D/M"}
| pointseries x="formatted_dag" y="logins"
| plot defaultStyle={seriesStyle lines=1 fill=1} xaxis={axisConfig position="bottom"} yaxis=true palette={palette "#140667" "#140667" gradient=true}
  label={formatnumber "0.0a"}
  font={font family="Arial, sans-serif" size=14 align="left" color="#140667" weight="normal"
underline=false italic=false}
| render css=".canvasRenderEl {
}"Hey @_Louw, so the plot function doesn't have a label argument like the progress function in the example. Maybe try and mapColumn with the formatted number like you did for the x axis.
Something like:
| mapColumn name="format_bytes" fn={getCell "total_bytes" | formatnumber "0.0a"}
| pointseries x="hour" y="format_bytes" color="host"@tims So now I have the following code:
| alterColumn column="timetal" type="date"
| mapColumn name="formatted_time" fn={getCell "timetal" | formatdate "HH"}
| mapColumn name="format_bytes" fn={getCell "logins" | formatnumber "0.0a"}
| pointseries x="formatted_time" y="format_bytes"
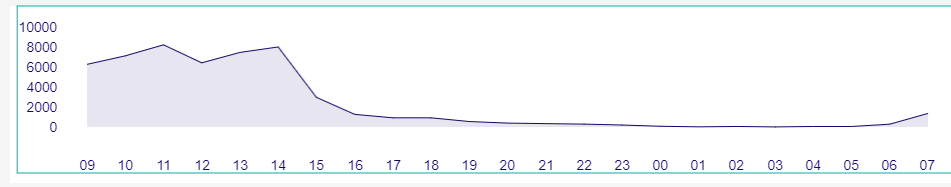
And my graph looks like it sorted all the entries somehow:
As we are counting logins, it should look like this:
Ah shoot, yes I forgot, it is sorting the y-axis as a string now due to the formatting. The charting library we are using is fairly limited we are hoping to provide more configuration options here in the near future.
@Catherine_Liu @corey.robertson @poff any ideas on how to format the y-axis?
@tims, @Catherine_Liu, @corey.robertson, @poff is there any update on this? 
Unfortunately, I don't think there is a way to accomplish this right now. I have filed an issue here: https://github.com/elastic/kibana/issues/52020
© 2020. All Rights Reserved - Elasticsearch
Apache, Apache Lucene, Apache Hadoop, Hadoop, HDFS and the yellow elephant logo are trademarks of the Apache Software Foundation in the United States and/or other countries.