OpenTelemetry metrics don't have labels

Hello,

I am trying to understand why otel metrics don't display the labels I set in my code.

I use:

  • go 1.17
  • elastic/apm 7.15.1
  • opentelemetry 1.0.1
  • native otlp collector 0.6.0

My metrics index has:

"apm-7.15.1-metric-000001" : {
    "mappings" : {
      "_meta" : {
        "beat" : "apm",
        "version" : "7.15.1"
      },
      "dynamic_templates" : [
        {
          "labels" : {
            "path_match" : "labels.*",
            "match_mapping_type" : "string",
            "mapping" : {
              "type" : "keyword"
            }
          }
        },

My golang code for adding one to a counter and attaching a label each time the value is incremented:

       warnMeter.warningCounter.Add(
		warnMeter.ctx,
		1,
		attribute.Int("labels.code", code),
		attribute.String("labels.text", text),
		attribute.String("labels.server", warnMeter.server),
	)

As you can see, I am trying to add one integer label and two string labels (or attributes, as the otel spec goes). Alas, I do not see any them in the index record (but I do see the counter value).

Considering a non-zero counter was only resolved on 7.15 (see the apm-server issue), is there a chance otel metric labels are not yet supported? Or am I doing something wrong?

Thanks in advance!
Ben

Hi @benbek, welcome to the forum!

As you can see, I am trying to add one integer label and two string labels (or attributes, as the otel spec goes). Alas, I do not see any them in the index record (but I do see the counter value).

Do you see any labels? I created a test program with your code snippet, and I end up with a metric document with the following label fields:

          "labels" : {
            "labels_server" : "server_name",
            "labels_text" : "some_text",
            "labels_code" : 400
          },

As you can see, "label" is repeated.

"labels." will be automatically prefixed to any attributes which are not OTel semantic conventions known to apm-server. So you should change "labels.code" to just "code", for example.

1 Like

Hi @axw, it's good to be here – and thank you for the prompt reply :hugs:

I've corrected my code to not include the labels. prefix – but it still doesn't solve the problem. As a matter of fact, I don't see any labels in the record.

I've also created a separate go application that demonstrates the problem. Will be happy to share it with you. I will really appreciate if you could jump on a quick call for troubleshooting.

@benbek,

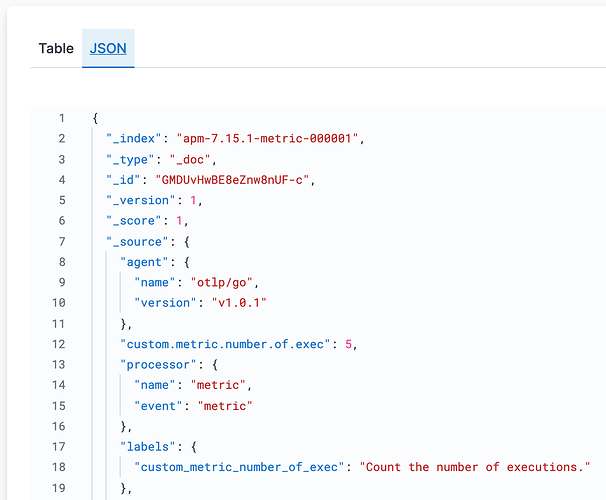
Could you try to attach the labels using the Bind() function? In the example below, I create an Int64Counter with an attribute and a description, which works fine.

This is what I get into the index:

For reference, I am using APM 7.15.1 here.

@riferrei

1 Like

Hi @riferrei, unfortunately Bind also doesn't work for me – no labels are present. Actually, in our experience Int64Counters don't log anything in the latest version, and we had to switch to Float64Counters.
Anyway, Bind() with labels doesn't work.

This is the entire index record, for your reference:

{
  "_index": "apm-7.15.1-metric-000001",
  "_type": "_doc",
  "_id": "YeLlvHwBt11rSkEJjx_g",
  "_version": 1,
  "_score": 1,
  "_source": {
    "agent": {
      "name": "opentelemetry/go",
      "version": "1.0.1"
    },
    "integer.counter": 1,
    "processor": {
      "name": "metric",
      "event": "metric"
    },
    "seconds.counter": 5,
    "metricset.name": "app",
    "observer": {
      "hostname": "8243f92668ee",
      "name": "instance-0000000005",
      "id": "c684a7b5-cabe-4038-8252-5fe7de80e56e",
      "ephemeral_id": "9af5300d-95b9-4447-a545-02b9ecc0d5f8",
      "type": "apm-server",
      "version": "7.15.1",
      "version_major": 7
    },
    "@timestamp": "2021-10-26T13:58:51.966Z",
    "_metric_descriptions": {
      "integer.counter": {
        "type": "counter"
      },
      "seconds.counter": {
        "type": "counter"
      }
    },
    "ecs": {
      "version": "1.11.0"
    },
    "service": {
      "name": "unknown_service____1go_build_otel_example",
      "language": {
        "name": "go"
      }
    },
    "event": {
      "ingested": "2021-10-26T13:58:53.663301490Z"
    }
  },
  "fields": {
    "service.name": [
      "unknown_service____1go_build_otel_example"
    ],
    "observer.name": [
      "instance-0000000005"
    ],
    "integer.counter": [
      1
    ],
    "processor.name": [
      "metric"
    ],
    "_metric_descriptions.integer.counter.type": [
      "counter"
    ],
    "observer.version_major": [
      7
    ],
    "service.language.name": [
      "go"
    ],
    "observer.hostname": [
      "8243f92668ee"
    ],
    "seconds.counter": [
      5
    ],
    "metricset.name": [
      "app"
    ],
    "observer.id": [
      "c684a7b5-cabe-4038-8252-5fe7de80e56e"
    ],
    "_metric_descriptions.seconds.counter.type": [
      "counter"
    ],
    "event.ingested": [
      "2021-10-26T13:58:53.663Z"
    ],
    "@timestamp": [
      "2021-10-26T13:58:51.966Z"
    ],
    "observer.ephemeral_id": [
      "9af5300d-95b9-4447-a545-02b9ecc0d5f8"
    ],
    "observer.version": [
      "7.15.1"
    ],
    "ecs.version": [
      "1.11.0"
    ],
    "observer.type": [
      "apm-server"
    ],
    "processor.event": [
      "metric"
    ],
    "agent.name": [
      "opentelemetry/go"
    ],
    "agent.version": [
      "1.0.1"
    ]
  }
}

(the bound metric is called integer.counter although it is Float64 :grinning_face_with_smiling_eyes: )

I'll be happy to provide any more details on the matter.

Thanks,
Ben

Yup, that's a bummer :sweat_smile:

At this point, the best thing to do is to analyze the problem at a code and dependencies level. If you could share a sample code that demonstrates the problem — I'm glad to take a look along with @axw :+1:t2:

@riferrei

Cool!

Please see this gist: OpenTelemetry + APM Metrics issue · GitHub

There's only one thing to configure there, and that's the endpoint in line 18.

Appreciate you taking a look :eyes:

Just executed your code AS-IS and the labels are being correctly created:

{
  "_index": "apm-7.15.1-metric-000001",
  "_type": "_doc",
  "_id": "qVMlvXwBz4zw3S0yejZf",
  "_version": 1,
  "_score": 1,
  "_source": {
    "agent": {
      "name": "opentelemetry/go",
      "version": "1.0.1"
    },
    "processor": {
      "name": "metric",
      "event": "metric"
    },
    "seconds.counter": 105,
    "labels": {
      "server": "localhost",
      "code": 299,
      "text": "my text"
    },
    "metricset.name": "app",
    "observer": {
      "hostname": "apm-server",
      "id": "9fe95d0b-f2b9-4377-98de-09a8c16d2301",
      "type": "apm-server",
      "ephemeral_id": "bf3b6a10-1d7e-40db-b542-c6555c5c2885",
      "version": "7.15.1",
      "version_major": 7
    },
    "@timestamp": "2021-10-26T15:08:41.458Z",
    "ecs": {
      "version": "1.11.0"
    },
    "service": {
      "name": "unknown_service_main",
      "language": {
        "name": "go"
      }
    },
    "event": {
      "ingested": "2021-10-26T15:08:42.462222Z"
    }
  },
  "fields": {
    "service.name": [
      "unknown_service_main"
    ],
    "processor.name": [
      "metric"
    ],
    "labels.text": [
      "my text"
    ],
    "observer.version_major": [
      7
    ],
    "service.language.name": [
      "go"
    ],
    "observer.hostname": [
      "apm-server"
    ],
    "seconds.counter": [
      105
    ],
    "metricset.name": [
      "app"
    ],
    "labels.code": [
      299
    ],
    "labels.server": [
      "localhost"
    ],
    "observer.id": [
      "9fe95d0b-f2b9-4377-98de-09a8c16d2301"
    ],
    "event.ingested": [
      "2021-10-26T15:08:42.462Z"
    ],
    "@timestamp": [
      "2021-10-26T15:08:41.458Z"
    ],
    "observer.ephemeral_id": [
      "bf3b6a10-1d7e-40db-b542-c6555c5c2885"
    ],
    "observer.version": [
      "7.15.1"
    ],
    "ecs.version": [
      "1.11.0"
    ],
    "observer.type": [
      "apm-server"
    ],
    "processor.event": [
      "metric"
    ],
    "agent.name": [
      "opentelemetry/go"
    ],
    "agent.version": [
      "1.0.1"
    ]
  }
}

This is getting more and more interesting. If not the code, I guess the culprit lies somewhere in the ES cloud. How do you suggest we proceed? Should I open a support ticket so you guys could access it?

I tested this with Elastic APM running locally via Docker. I can test using Elastic Cloud. Just a sec...

Just validated here that — using the same code you provided — it also correctly created the labels in Elastic Cloud, as you can see here:

{
  "_index": "apm-7.15.1-metric-000001",
  "_type": "_doc",
  "_id": "8BGivXwBJ7UxgUg2gMtC",
  "_version": 1,
  "_score": 1,
  "_source": {
    "agent": {
      "name": "opentelemetry/go",
      "version": "1.0.1"
    },
    "processor": {
      "name": "metric",
      "event": "metric"
    },
    "seconds.counter": 10,
    "labels": {
      "server": "localhost",
      "code": 299,
      "text": "my text"
    },
    "metricset.name": "app",
    "observer": {
      "hostname": "ee23a1d26beb",
      "name": "instance-0000000000",
      "id": "36ed24d2-6502-4e97-bd09-bd744e122136",
      "ephemeral_id": "957ee57f-65b6-4ffd-a4e6-f32875a27b72",
      "type": "apm-server",
      "version": "7.15.1",
      "version_major": 7
    },
    "@timestamp": "2021-10-26T17:25:14.821Z",
    "ecs": {
      "version": "1.11.0"
    },
    "service": {
      "name": "unknown_service_main",
      "language": {
        "name": "go"
      }
    },
    "event": {
      "ingested": "2021-10-26T17:25:15.967759904Z"
    }
  },
  "fields": {
    "service.name": [
      "unknown_service_main"
    ],
    "observer.name": [
      "instance-0000000000"
    ],
    "processor.name": [
      "metric"
    ],
    "labels.text": [
      "my text"
    ],
    "observer.version_major": [
      7
    ],
    "service.language.name": [
      "go"
    ],
    "observer.hostname": [
      "ee23a1d26beb"
    ],
    "seconds.counter": [
      10
    ],
    "metricset.name": [
      "app"
    ],
    "labels.code": [
      299
    ],
    "labels.server": [
      "localhost"
    ],
    "observer.id": [
      "36ed24d2-6502-4e97-bd09-bd744e122136"
    ],
    "event.ingested": [
      "2021-10-26T17:25:15.967Z"
    ],
    "@timestamp": [
      "2021-10-26T17:25:14.821Z"
    ],
    "observer.ephemeral_id": [
      "957ee57f-65b6-4ffd-a4e6-f32875a27b72"
    ],
    "observer.version": [
      "7.15.1"
    ],
    "ecs.version": [
      "1.11.0"
    ],
    "observer.type": [
      "apm-server"
    ],
    "processor.event": [
      "metric"
    ],
    "agent.name": [
      "opentelemetry/go"
    ],
    "agent.version": [
      "1.0.1"
    ]
  }
}

But to use Elastic Cloud, I had to change your code to provide the bearer token for authentication.

type TelConfig struct {
	Endpoint    string
	BearerToken string
}

:arrow_down:

securityDialOption := otlpmetricgrpc.WithInsecure()

var headersOption otlpmetricgrpc.Option

if strings.HasSuffix(t.config.Endpoint, ":443") {

securityDialOption = otlpmetricgrpc.WithTLSCredentials(credentials.NewTLS(&tls.Config{}))

headersOption = otlpmetricgrpc.WithHeaders(map[string]string{"Authorization": t.config.BearerToken})

}

@riferrei

Thanks for checking! Really appreciate it.
By the process of elimination, could the issue be the otel collector? As mentioned, we use version 0.6.0 (GitHub - open-telemetry/opentelemetry-helm-charts: OpenTelemetry Helm Charts). Is there a possibility to do a re-test with that collector?

You can certainly test this without the collector. Since your code has been written to send the metrics over OTel/gRPC and Elastic APM does support this natively — you can bypass the collector altogether.

TL;DR: your endpoint should be Elastic APM and not the collector.

@riferrei

1 Like

Just confirmed it – I have labels when I'm talking directly to APM. Hooray!
Created an issue for opentelemetry-collector: Meter values sent to Elastic APM are missing labels · Issue #4273 · open-telemetry/opentelemetry-collector · GitHub.

Once again, thank you for all your help :heart_decoration:

3 Likes

This topic was automatically closed 28 days after the last reply. New replies are no longer allowed.