Hi,
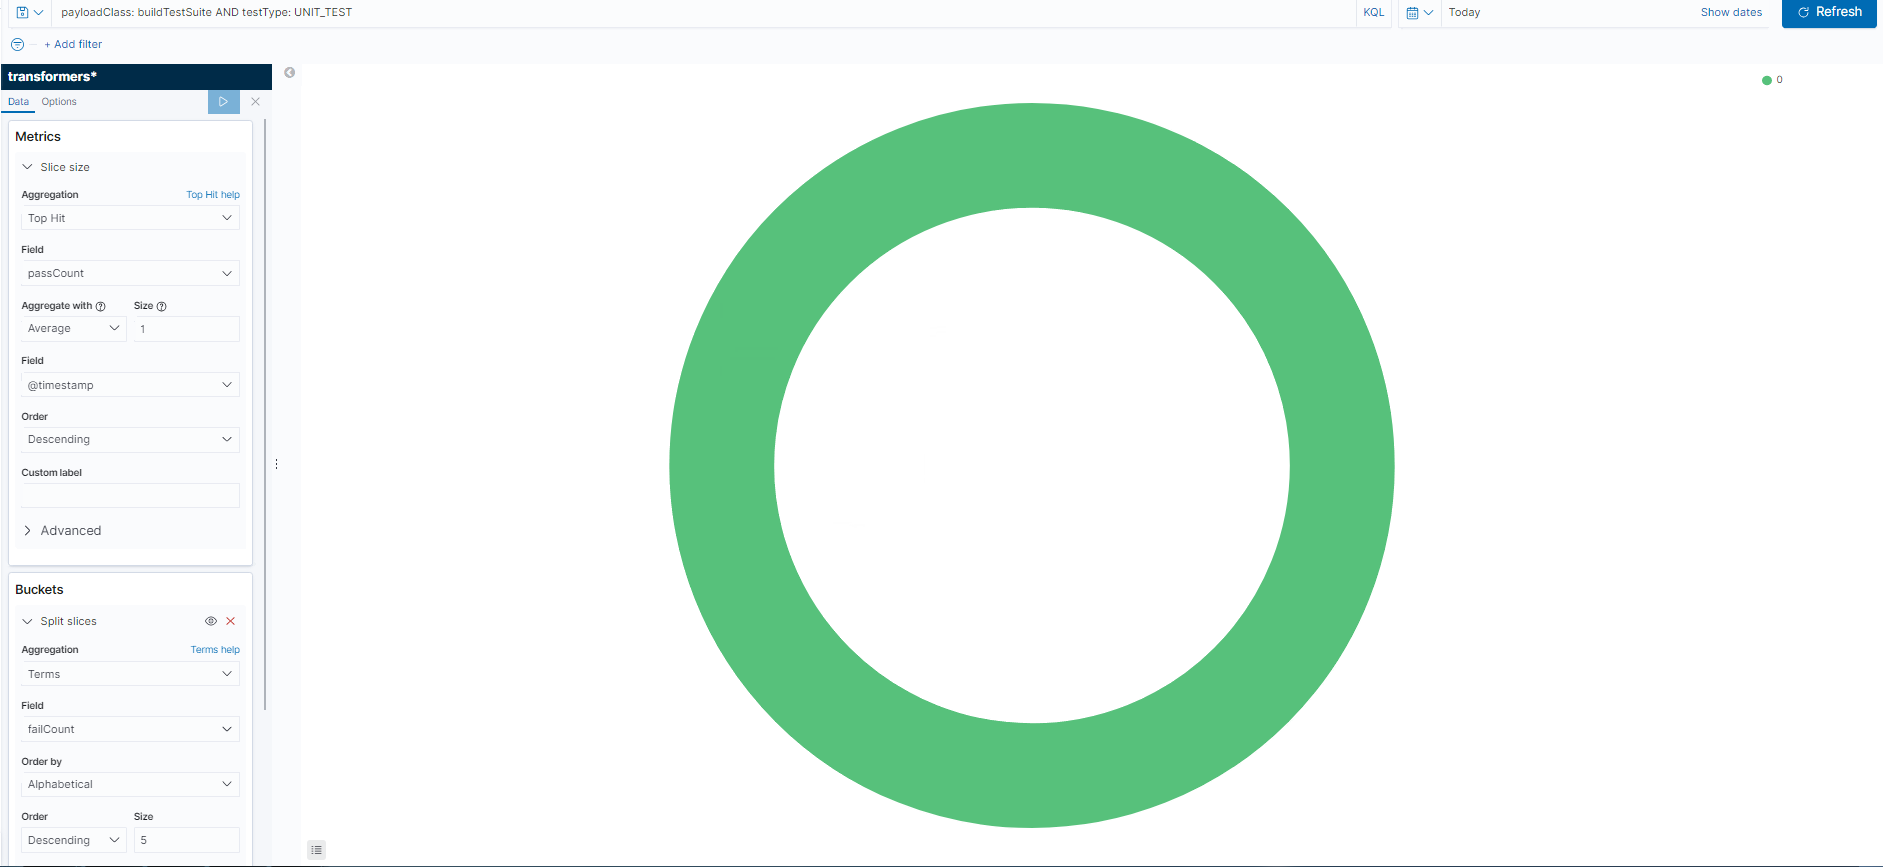
Is it possible to make a pie chart using the value itself in the top hit event?
for example, I have in my top hit event :
passCount: 3
failCount: 1
skipCount: 0
I want to make a pie chart from that information, could you help me?
Hi,
Is it possible to make a pie chart using the value itself in the top hit event?
for example, I have in my top hit event :
passCount: 3
failCount: 1
skipCount: 0
I want to make a pie chart from that information, could you help me?
Hi Nathan,
Thank you for your answer.
I think you misunderstood my question.
I am trying to take only the last event(top hit) and look at it "micro" and not "macro".
My meaning is - the pie chart will take the name of a field, take the value it has, and will show it in a pie chart.
Just like my example, my pie chart will be 75% passCount, and 25% failCount.
Thanks.
That is what top hit will do. It will take the value from the first document for the group based on sort configuration.
© 2020. All Rights Reserved - Elasticsearch
Apache, Apache Lucene, Apache Hadoop, Hadoop, HDFS and the yellow elephant logo are trademarks of the Apache Software Foundation in the United States and/or other countries.