Is there a way to plot time series graph so that there are bars when records count is 0 and no bars when records count is > 0 ? Given a time interval is selected for plotting (say 30min) for the data in last 24hrs ?
So, essentially showing when there was no data.
I'm afraid that's not possible. How would the bar look like when record count is 0 if it were to have height?
That's an interesting case, I think that is technically possible with some Lens formula magic.
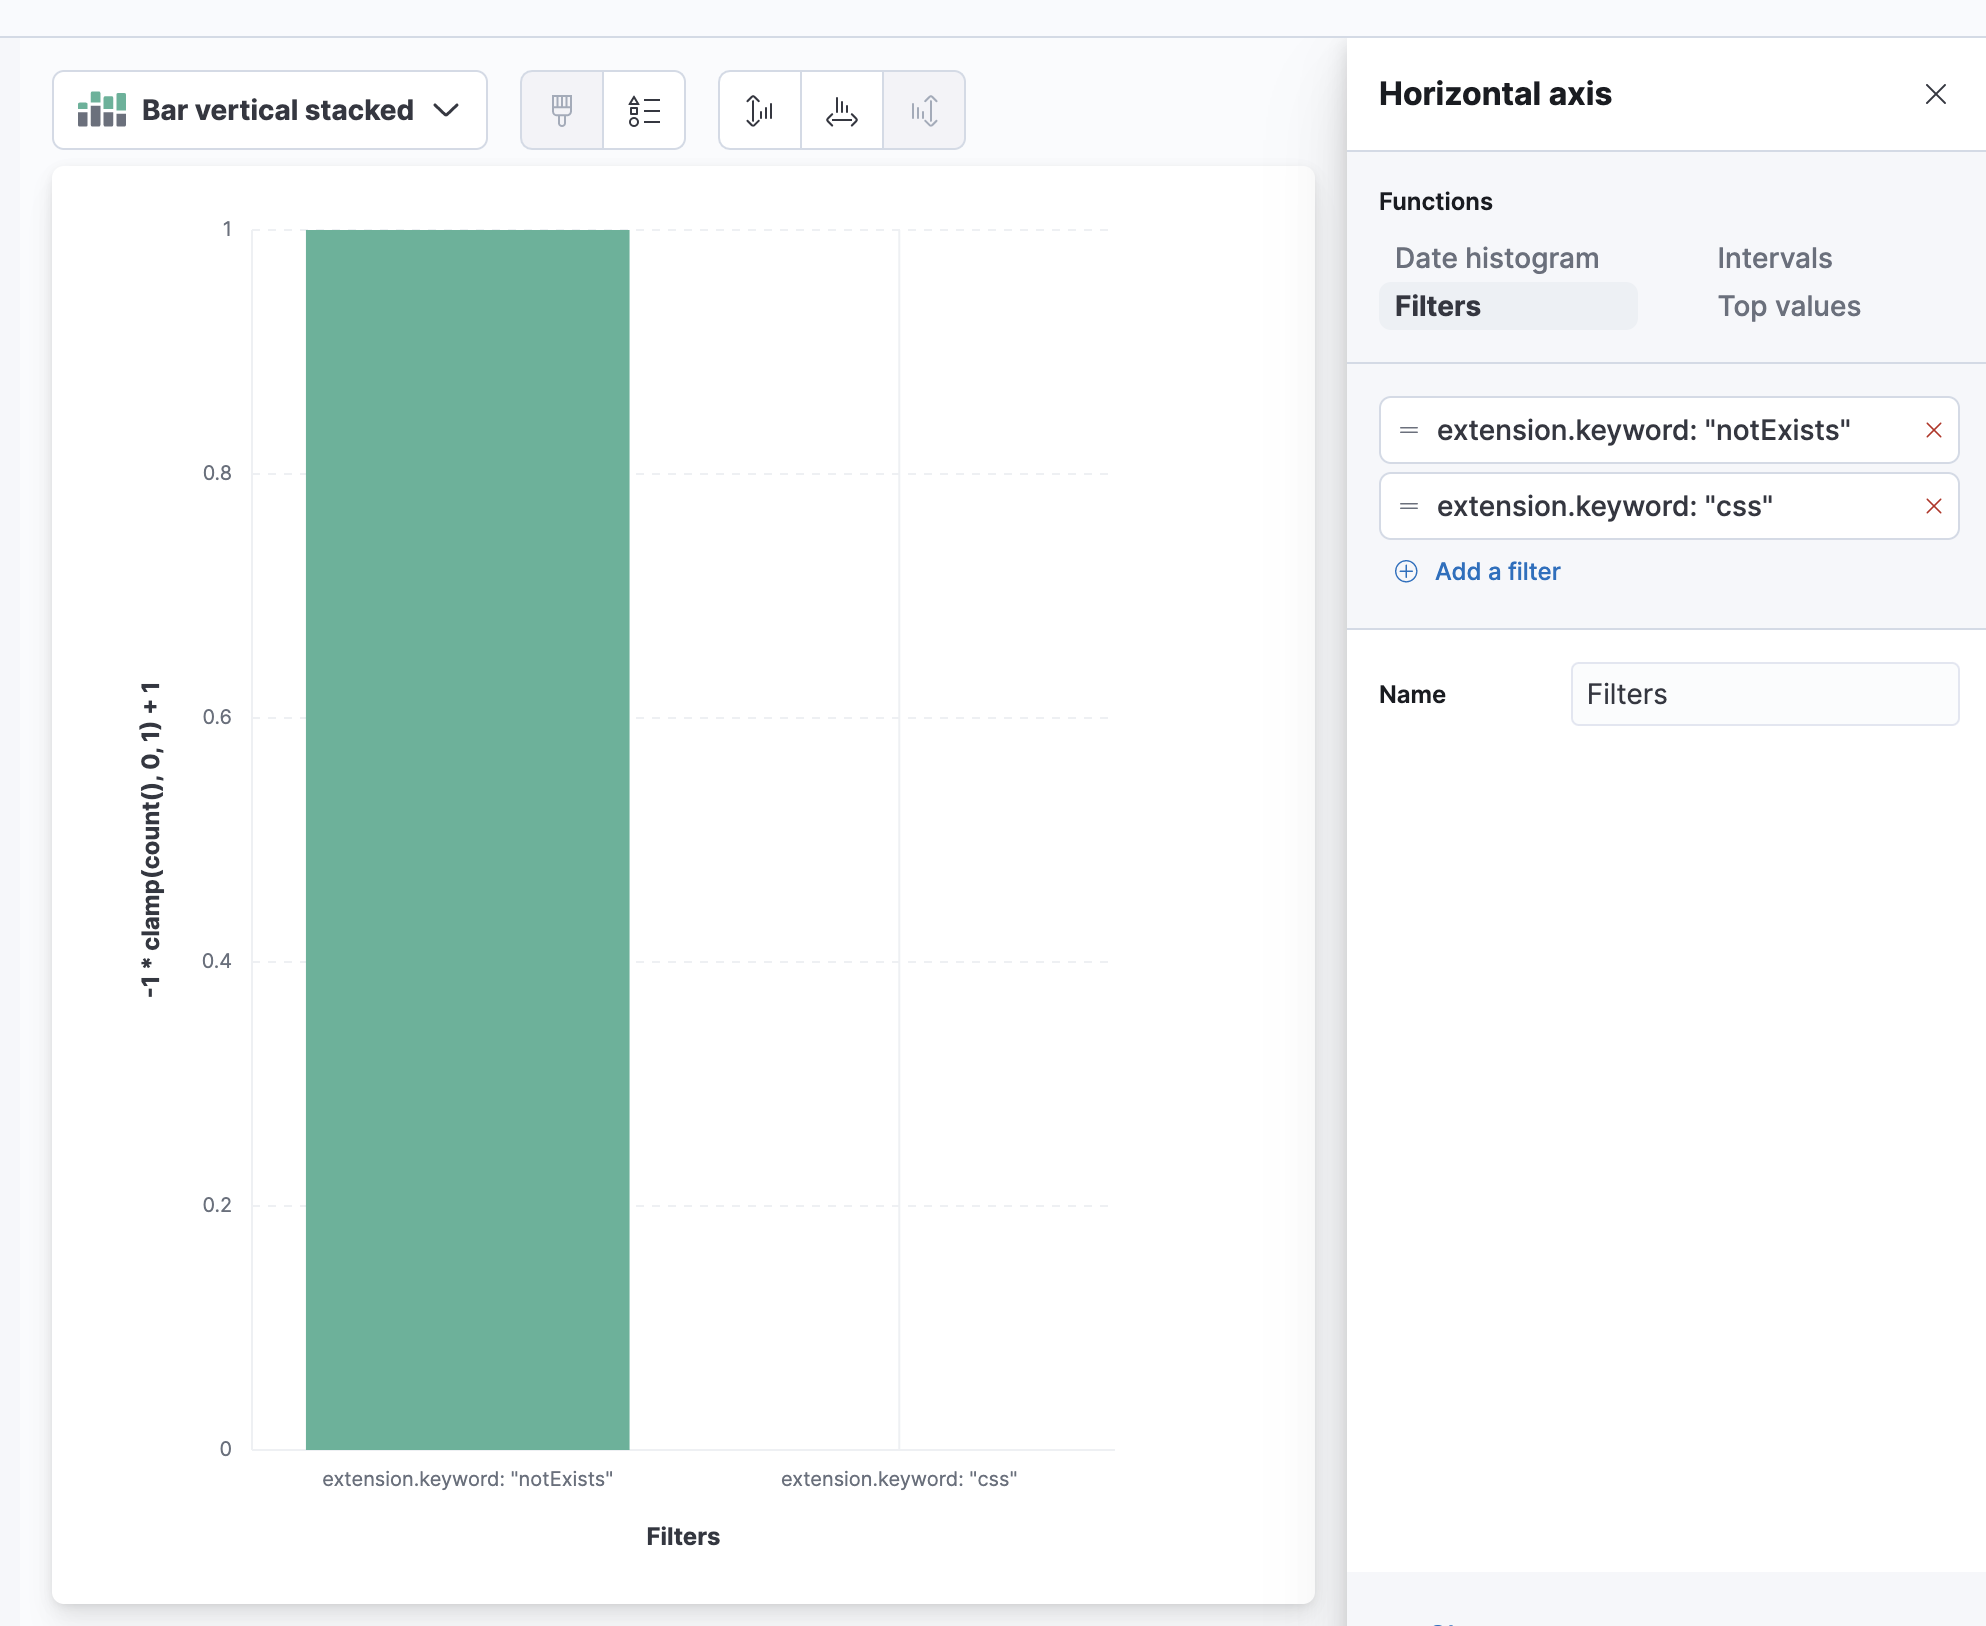
In this example I've used two filters: in one case there's a file extensions that does not exists in the dataset, in the other case "css", which is known to be there.
For the metric side I've using this formula:
-1 * clamp(count(), 0, 1) + 1
Perhaps a table would suffice as well: