I have a user having only privilege to interact with the index pattern pattern-b-*. Default index pattern is pattern-a-*. The user is accessing a dashboard with visualisations only requesting pattern-b-* indexes, which I verified in the dashboard and visualisations exports.
The problem is that no matter which dashboard is opened, he would get the alert
No matching indices found: No indices match pattern "pattern-a-*"
I solved this by giving the view_index_metadata privilege to the default index. But it still triggers me. My question is why would any dashboard make a request to the default index pattern even if no visualisation is requesting it?
what kind of visualizations are on that dashboard? It can be that if all those visualizations are of a type that don't report their index pattern (which e.g. TSVB and Vega didn't do in earlier versions), that the dashboard doesn't know which index patterns are present on in, in which case it will try to load the default for showing the field list in the filter UI. Could you maybe click the "Add filter" button on such a dashboard and share a screenshot of it, that might help seeing this.
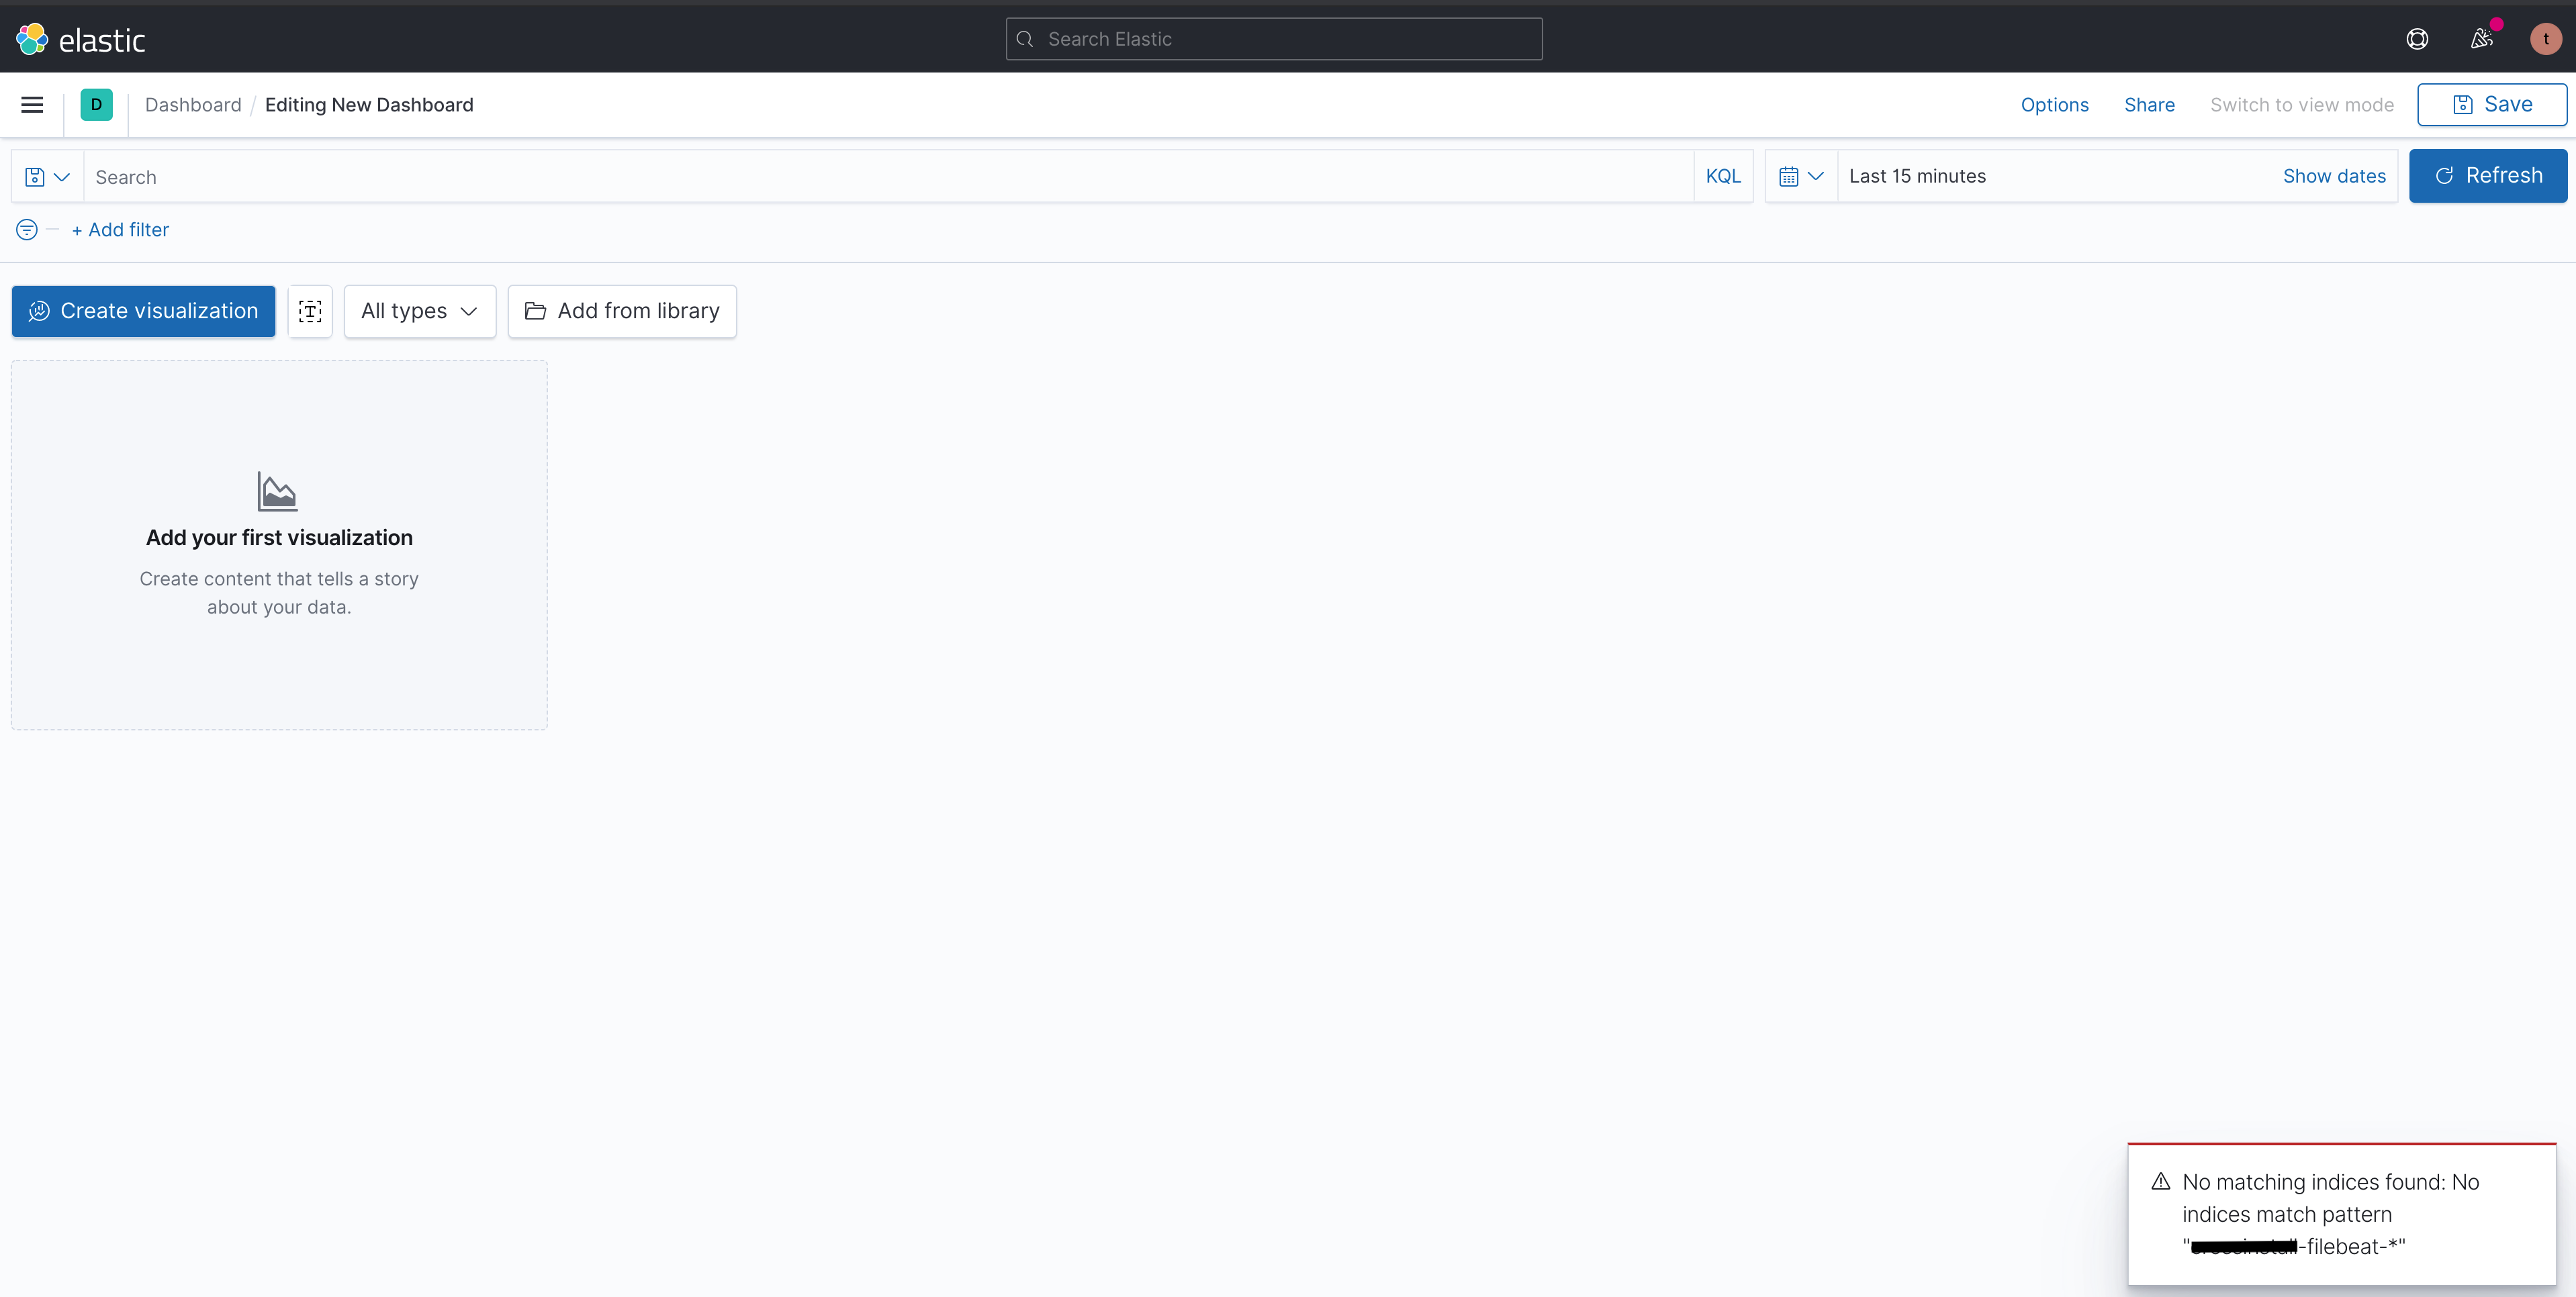
I found out that the issue appears even on an empty dashboard. I really don't know what's happening there.. Attached are screenshots of the role privileges and empty screenshot view. The index pattern on the error window is the default pattern. Kibana version is 7.13.0.
yes that def makes sense on an empty dashboard. So we need to populate fields in the "Add filter" dialog in the filter bar. When you're not having any specific index patterns on the dashboard (e.g. because it's empty) we're filling in the fields of the default index pattern. So if a user won't have access to that, they'll see this error message.
So I checked the non-empty dashboard and filter terms are from pattern-b-* and not the default index. Error still happens here too. All visualisations are linked to pattern-b-* even the TSVB. I exported the dashboard and associated visualisations to ndjson, but can't really see something wrong.
Apache, Apache Lucene, Apache Hadoop, Hadoop, HDFS and the yellow elephant
logo are trademarks of the
Apache Software Foundation
in the United States and/or other countries.