I have a question which way of writing a query is faster.
Let's say we want to calculate two things, total revenue and total unique users, both of which are separate "event types", in order to either visualise them directly or to visualise average revenue per user.
Is it faster to, in pseudo code terms, just calculate the values directly such as:
totalRevenue = sum of data.purchasePriceInUSD,
uniqueUsers = cardinality of data.userId.hash (murmur3 hash)
with a filter of *.
Or is it faster to filter them first it such as
for totalRevenue filter on data.eventType:'Purchase'
for uniqueUsers filter on data.eventType:'AppLoad'
(Both approaches will yield the same result)
In other words, is it faster to process more events with the sum and cardinality operators (purchasePriceInUSD is only available in 'Purchase' type events, userId.hash is available in all event types) without filtering, or is it faster to first filter to only the relevant events and operate on them only? My intuition says it's faster to filter first but wanted to check here for guidelines. We have several billion events in total.
Oh and if it's faster to filter first, is there any optimisations that can be done regarding the string comparison for the event name? Something like creating a hash out of the event names, and searching for the hashed versions instead? I would assume doing billions of string comparisons would be slower than checking the hashes... However, writing the queries would be a pain unless there's some hash function that can be used there?
We could also auto generate boolean properties out of the event name and do boolean comparisons instead. Would these be meaningful things to do or would the impact be negligible?
Any guidelines on this would be appreciated as well.
Hi Tommi,
I think the Elasticsearch forum would be a better place for this question since it's about Elasticsearch query performance.
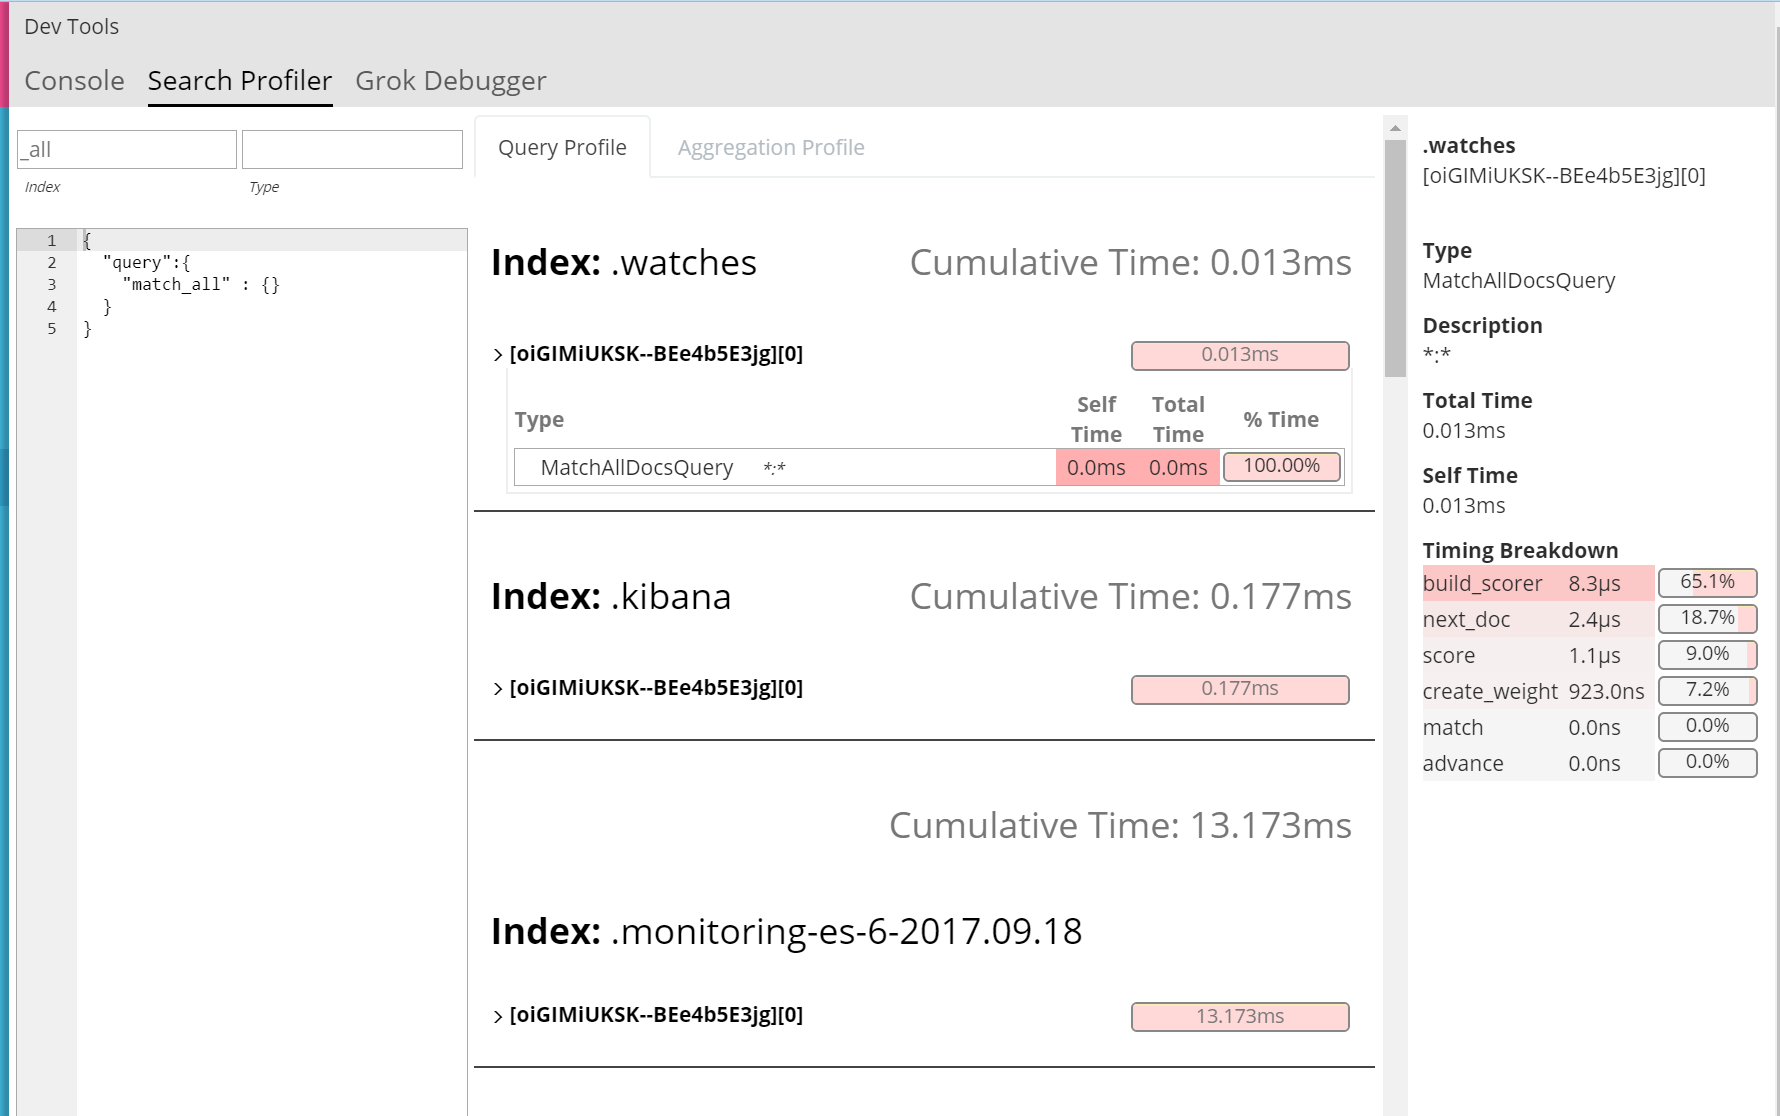
But you can see the statistics of your queries in Kibana by clicking the little arrow near the bottom of the page and then clicking the Statistics button or selecting it from the list depending on your Kibana version.
Apache, Apache Lucene, Apache Hadoop, Hadoop, HDFS and the yellow elephant
logo are trademarks of the
Apache Software Foundation
in the United States and/or other countries.