@kwoxer thanks for your question. We'd like to route this to the right team. Can you tell us more about what part of Kibana (and what version) you are using for this?
And part of Kibana? Well I just want to create some calculations. So in this example I have a timespan and want to know how much time my robot saved compared to when a human would have done it.
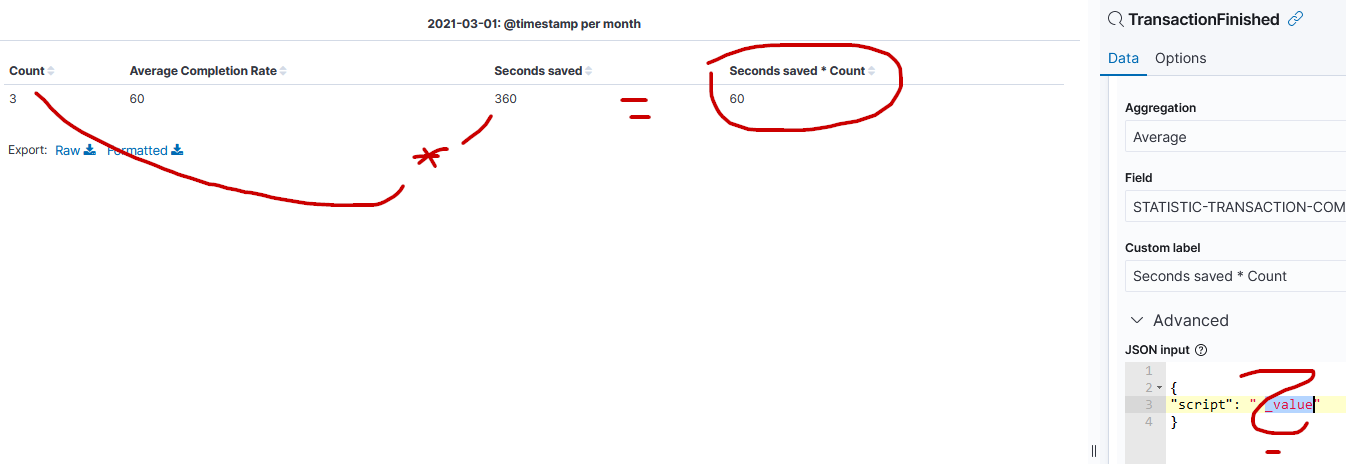
So as you can see the robot ran 3 times. And the average completion rate is 60% (where the robot stopped at in the process, e.g. stopping because there was data missing or so), that 60% value came from 80%, 50% and 50% btw. The Seconds Saved stands for how much seconds the robot saved. So as example the manual run of 100% of the process takes 600 seconds. So the 60% of 600 are the 360 seconds. And finally the Seconds Saved * Count are what I'm interested in. So currently I only know how much one is saving. Now I want to multiply it with the overall Count.
So At the end it would also be fine to only see one value. But this with the table is also very interesting. I would like to have both actually.
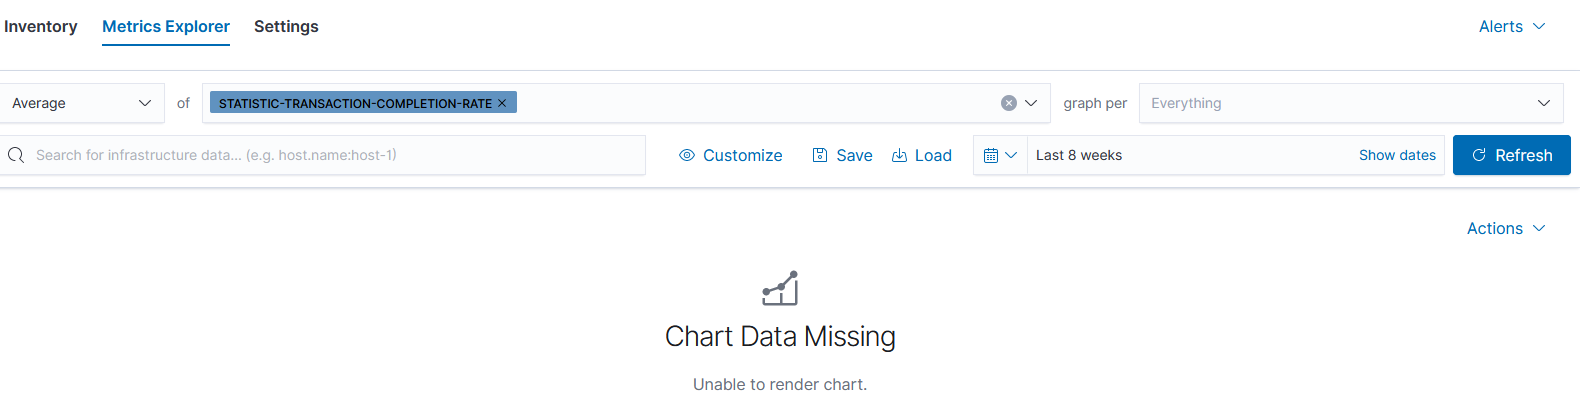
Ohh and I also tried to use the Metric explorer but the Chart is always empty. And I also didn't find out any tutorial that helped me there. Not sure what I do incorrect there. I tried out any different Average and graph per and so on:
@kwoxer Is STATISTIC-TRANSACTION-COMPLETE-RATEa scripted field you created in an index pattern? If so, the Metrics Explorer doesn't have support for those fields... yet. We are working on integrating with Kibana index patterns and ultimately the new runtime fields implementation which will be perfect for stuff like this.
Not for Metrics Explorer, you can do that using TSVB (under Visualizations). We are working on supporting runtime fields via Kibana index patterns. Unfortunately, I don't have a timeline for when that will be released.
Good to know, yes that is looking kind of what I need. But now how to reference the count? Really hard to understand. Or is it impossible with the TSVB?
I just solved my issue kind of with the Sum of a Scripted field. But as Scripted fields are slower and very static I would more prefer a better way if possible. Also I also need this 1680 seconds value as visualization. Sure I could now hide the other values simply but it will still remain as a table. I would rather prefer a vis of the metrics showing big value. Any tips on this?
Maybe the last question. As you can see on SCANUC process, when there is no field in the TimeSpan. Is there any way to just show a 0 maybe instead of no data?
But this is really just cosmetic, overall it works have many thanks.
That happens where there is ZERO rows returned. Maybe we need a "No Data" view or a way to configure it so either it shows the default "No data" message or just displays ZERO for the value.
Apache, Apache Lucene, Apache Hadoop, Hadoop, HDFS and the yellow elephant
logo are trademarks of the
Apache Software Foundation
in the United States and/or other countries.