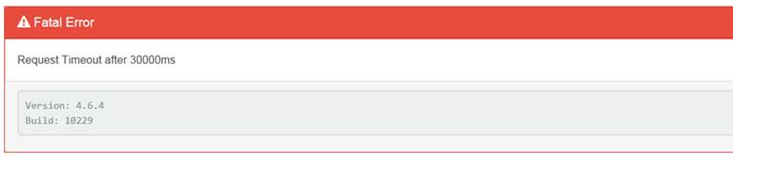
when i click on indices tab on Kibana settings Menu, i am getting "Request Timeout after 30000ms " error.
someone please help and advise how can i increase the value.
I am using elastic/kibana version 4.

I have not used that version in years, but it looks like elasticsearch.requestTimeout can be specified in the Kibana config file.
Thanks Christian for your response !!
is this setting applicable for both Kibana 4 & 5 ?
Probably, but I would always recommend checking the documentation for your particular version.
It may also be worthwhile looking into why it times out in the first place. Do you have too much data for your cluster? Do you have too many small shards? Have you outgrown your hardware?
We were unable to determine,
please let me know how to find out, we are seeing this issue recently.
we are tying to understand the recommended shard size.
infact we are pushing the structured data directly to elastic search with curl.
we are not using filebeat/logstash at present.
Can you provide the output of the cluster stats API and describe the use case?
Use case is we are capturing predefined health check values/outputs from our clients with our health check scripts running in specific intervals and pushing it to elastic search in structured data with json, once data is available on elastic and kibana generating dashboards.
{
"timestamp" : 1535738104784,
"cluster_name" : "XXXXXXX_CLUSTER",
"status" : "green",
"indices" : {
"count" : 117,
"shards" : {
"total" : 234,
"primaries" : 117,
"replication" : 1.0,
"index" : {
"shards" : {
"min" : 2,
"max" : 2,
"avg" : 2.0
},
"primaries" : {
"min" : 1,
"max" : 1,
"avg" : 1.0
},
"replication" : {
"min" : 1.0,
"max" : 1.0,
"avg" : 1.0
}
}
},
"docs" : {
"count" : 123255603,
"deleted" : 61785
},
"store" : {
"size" : "54gb",
"size_in_bytes" : 57987858300,
"throttle_time" : "0s",
"throttle_time_in_millis" : 0
},
"fielddata" : {
"memory_size" : "3.2mb",
"memory_size_in_bytes" : 3396488,
"evictions" : 0
},
"query_cache" : {
"memory_size" : "277.2mb",
"memory_size_in_bytes" : 290747824,
"total_count" : 27927453,
"hit_count" : 1681824,
"miss_count" : 26245629,
"cache_size" : 7000,
"cache_count" : 21452,
"evictions" : 14452
},
"completion" : {
"size" : "0b",
"size_in_bytes" : 0
},
"segments" : {
"count" : 2193,
"memory" : "166.4mb",
"memory_in_bytes" : 174572590,
"terms_memory" : "126.5mb",
"terms_memory_in_bytes" : 132707094,
"stored_fields_memory" : "31.7mb",
"stored_fields_memory_in_bytes" : 33287064,
"term_vectors_memory" : "0b",
"term_vectors_memory_in_bytes" : 0,
"norms_memory" : "1.6mb",
"norms_memory_in_bytes" : 1716864,
"doc_values_memory" : "6.5mb",
"doc_values_memory_in_bytes" : 6861568,
"index_writer_memory" : "565.9kb",
"index_writer_memory_in_bytes" : 579565,
"index_writer_max_memory" : "19gb",
"index_writer_max_memory_in_bytes" : 20501446656,
"version_map_memory" : "4.7kb",
"version_map_memory_in_bytes" : 4908,
"fixed_bit_set" : "0b",
"fixed_bit_set_memory_in_bytes" : 0
},
"percolate" : {
"total" : 0,
"time" : "0s",
"time_in_millis" : 0,
"current" : 0,
"memory_size_in_bytes" : -1,
"memory_size" : "-1b",
"queries" : 0
}
},
"nodes" : {
"count" : {
"total" : 7,
"master_only" : 3,
"data_only" : 2,
"master_data" : 0,
"client" : 0
},
"versions" : [ "2.4.2" ],
"os" : {
"available_processors" : 42,
"allocated_processors" : 42,
"mem" : {
"total" : "88.5gb",
"total_in_bytes" : 95035625472
},
"names" : [ {
"name" : "Linux",
"count" : 7
} ]
},
"process" : {
"cpu" : {
"percent" : 9
},
"open_file_descriptors" : {
"min" : 276,
"max" : 2479,
"avg" : 888
}
},
"jvm" : {
"max_uptime" : "1.6d",
"max_uptime_in_millis" : 145886310,
"versions" : [ {
"version" : "1.8.0_121",
"vm_name" : "Java HotSpot(TM) 64-Bit Server VM",
"vm_version" : "25.121-b13",
"vm_vendor" : "Oracle Corporation",
"count" : 7
} ],
"mem" : {
"heap_used" : "65.6gb",
"heap_used_in_bytes" : 70541977232,
"heap_max" : "182gb",
"heap_max_in_bytes" : 195467804672
},
"threads" : 575
},
"fs" : {
"total" : "1.3tb",
"total_in_bytes" : 1527597965312,
"free" : "1.3tb",
"free_in_bytes" : 1468908515328,
"available" : "1.2tb",
"available_in_bytes" : 1391276986368,
"spins" : "true"
},
"plugins" : [ {
"name" : "license",
"version" : "2.4.2",
"description" : "Internal Elasticsearch Licensing Plugin",
"jvm" : true,
"classname" : "org.elasticsearch.license.plugin.LicensePlugin",
"isolated" : false,
"site" : false
}, {
"name" : "shield",
"version" : "2.4.2",
"description" : "Elasticsearch Shield (security)",
"jvm" : true,
"classname" : "org.elasticsearch.shield.ShieldPlugin",
"isolated" : false,
"site" : false
} ]
}
}
That looks fine as far as I can tell. You have a quite large number of shards given the data volume, which could have an impact, but it is not extreme. Have you tried to identify what is limiting performance, e.g. CPU usage, disk I/O etc?
i don't find issue with respect to CPU,Memory utilization, only one of the master node is using 70%. how to find why my master nodes are not same CPU usage.
Hi, Please advise how can we config number shards, is this based on indexes or CPU/Memory/Disk ?
please refer the above configuration which i have pasted.
Elasticsearch can be quite I/O intensive, so also check I/O statistics, e.g. using iostat. How much RAM do the hosts with your data nodes have? How much have you assigned to heap out of this?