After parsing JSON log with the filter I used below
filter {
    if [type] == "vizql_cpp" or [type] == "vizql_tabprotosrv" {
        json {
            source => "message"
        }
        mutate {
            rename => { "v" => "v_%{k}" }
        }
        date {
            match => ["ts", "YYYY-MM-dd|HH:mm:ss", "MMM  d HH:mm:ss", "MMM dd HH:mm:ss", "ISO8601"]
            target => "@timestamp"
        }
    }
}
I had to increase the "index.mapping.total_fields.limit": 100000 as this JSON log file has created more than the default number of 1000 index fields and kept warning Limit of total fields [1000] has been exceeded
There were few warning regarding data type conversions like below.
[2021-02-10T10:48:18,077][WARN ][logstash.outputs.elasticsearch][main][5407fae34cad552531c896a58609701a37967d1fe753424bc18f596bd9c3372e] Could not index event to Elasticsearch. {:status=>400, :action=>["index", {:_id=>nil, :_index=>"06543072-vizql_cpp2", :routing=>nil, :_type=>"_doc"}, #LogStash::Event:0x3db19409], :response=>{"index"=>{"_index"=>"06543072-vizql_cpp2", "_type"=>"_doc", "_id"=>"b40yiXcBtCBrnwvsEjrn", "status"=>400, "error"=>{"type"=>"illegal_argument_exception", "reason"=>"mapper [v_server-startup-options.file.encoding] cannot be changed from type [text] to [ObjectMapper]"}}}}
Ignoring the warning above, the index created and the final result of index pattern in Kibana was 9055 fields in total.
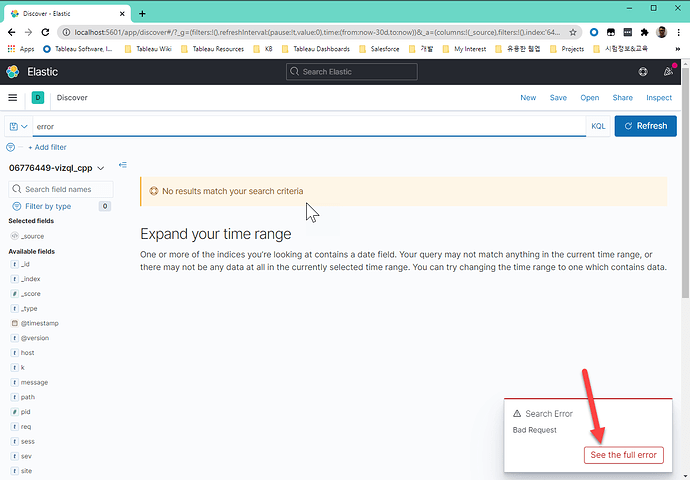
With that index, search keyword 'error' given, throw an search error regardless Lucene or KQL. The error saying 'all shards failed'
I have a single node Elasticsearch.
The health of the index in the summary page is green with the settings as below.
{
"index.blocks.read_only_allow_delete": "false",
"index.priority": "1",
"index.query.default_field": [
"*"
],
"index.refresh_interval": "1s",
"index.write.wait_for_active_shards": "1",
"index.routing.allocation.include._tier_preference": "data_content",
"index.mapping.total_fields.limit": "100000",
"index.mapping.ignore_malformed": "true",
"index.number_of_replicas": "0"
}
What went wrong? Any idea?
The Json log file looks like as below.
{"ts":"2020-12-12T00:00:12.305","pid":6648,"tid":"5578","sev":"info","req":"-","sess":"-","site":"-","user":"-","k":"rotate-log","v":{"new-path":"C:\ProgramData\Tableau\Tableau Server\data\tabsvc\logs\vizqlserver\nativeapi_vizqlserver_1-0_2020_12_12_00_00_00.txt","old-path":"C:\ProgramData\Tableau\Tableau Server\data\tabsvc\logs\vizqlserver\nativeapi_vizqlserver_1-0_2020_12_11_00_00_00.txt"}}
{"ts":"2020-12-12T00:00:12.303","pid":6648,"tid":"52b0","sev":"info","req":"-","sess":"-","site":"-","user":"-","k":"msg","v":"Resource Manager: CPU info: 0%"}
{"ts":"2020-12-12T00:00:12.303","pid":6648,"tid":"52b0","sev":"info","req":"-","sess":"-","site":"-","user":"-","k":"msg","v":"Resource Manager: Memory info: 1,801,904,128 bytes (current process);14,939,303,936 bytes (Tableau total); 29,661,540,352 bytes (total of all processes); 11 (info count)"}
{"ts":"2020-12-12T00:00:12.304","pid":6648,"tid":"52b0","sev":"info","req":"-","sess":"-","site":"-","user":"-","k":"cachingdomparser-getdom-stats","v":{"elements-count":4,"hits":0,"logging-period-in-sec":60,"misses":0}}
{"ts":"2020-12-12T00:01:12.313","pid":6648,"tid":"52b0","sev":"info","req":"-","sess":"-","site":"-","user":"-","k":"msg","v":"Resource Manager: CPU info: 0%"}


