I am having two Systems (System1 & System2).
I am unable to collect metricbeat logs of System2 in the Elasticsearch of System1.
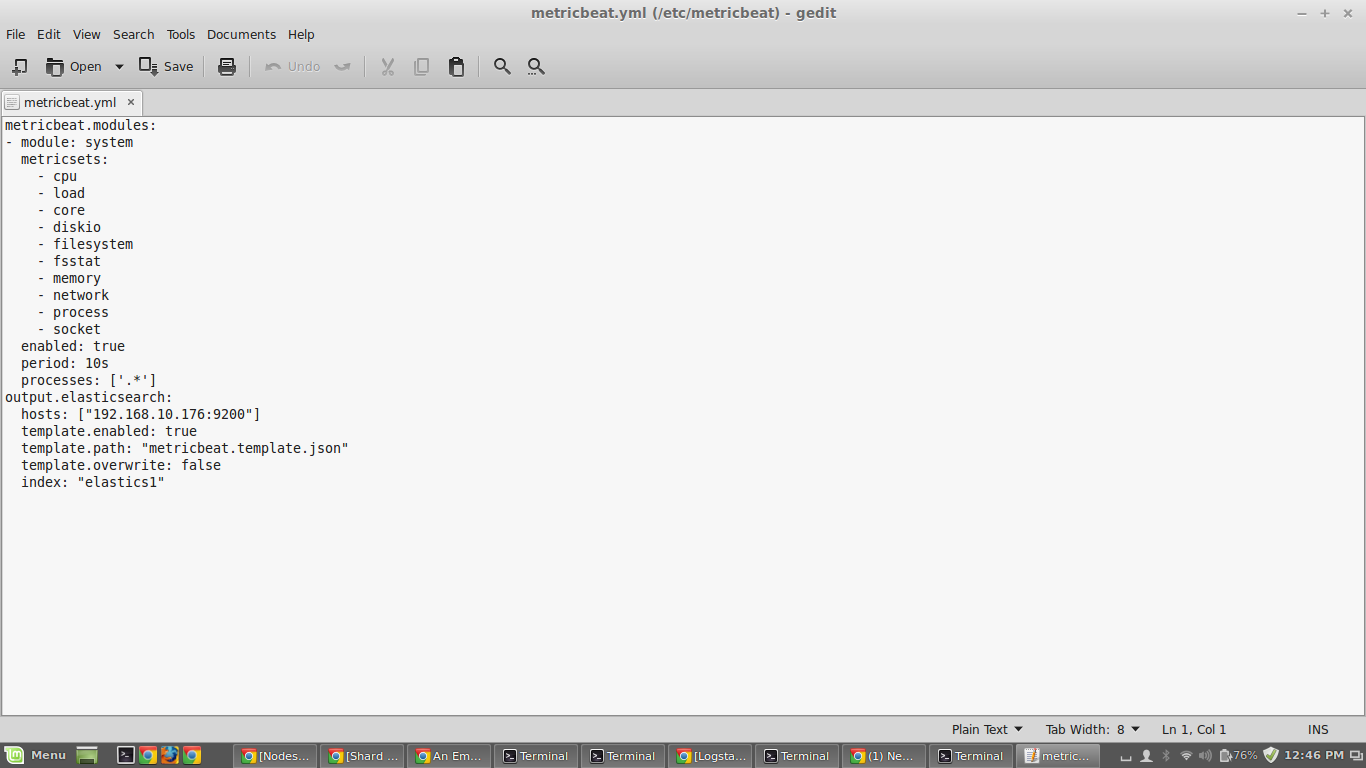
My metricbeat.yml file configuration is as below
Help would be really appreciated
Thanks
Hi @shrikantgulia,
In general I think that question is better suited for the #beats:metricbeat forum but maybe I'm able to give some pointers.
What do you mean by that? Is 192.168.10.176 reachable from System2 (ping)? Is Elasticsearch bound to 0.0.0.0 instead of loopback? What happens if you issue curl http://192.168.10.176:9200/? If you don't see anything like this:
{
  "name" : "OSjLgO2",
  "cluster_name" : "elasticsearch",
  "cluster_uuid" : "-IZx01UcSkiYc4aj_7Ky_w",
  "version" : {
    "number" : "5.5.0",
    "build_hash" : "260387d",
    "build_date" : "2017-06-30T23:16:05.735Z",
    "build_snapshot" : false,
    "lucene_version" : "6.6.0"
  },
  "tagline" : "You Know, for Search"
}
Then check config/elasticsearch.yml, specifically network.host. It should be set to 0.0.0.0 to listen on all network interfaces (don't forget to restart Elasticsearch if you change the configuration). By default, Elasticsearch only listens on loopback (i.e. 127.0.0.1).
If that does not help, please check the logs of metricbeat and Elasticsearch for further hints.
Daniel
© 2020. All Rights Reserved - Elasticsearch
Apache, Apache Lucene, Apache Hadoop, Hadoop, HDFS and the yellow elephant logo are trademarks of the Apache Software Foundation in the United States and/or other countries.