Hi, I'm new to ELK and trying to learn what all I could from your documentation and various blogs.
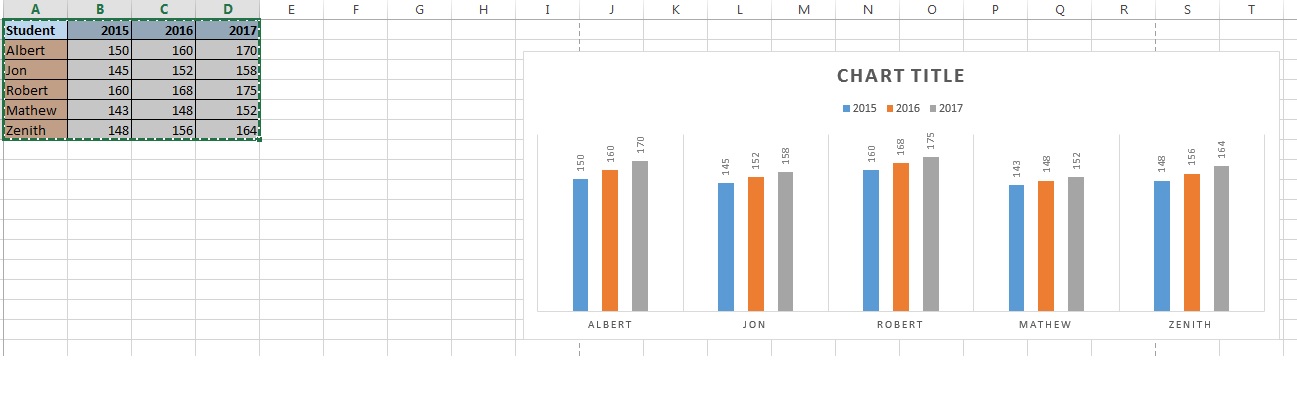
I'm trying to create a simple graph in Kibana which depicts the height of students across years.
I'm trying to reproduce the same graph that I have created in excel with Kibana. Attaching the graph of XLS which I'm trying to replicate in Kibana and what I got from Kibana. Is there a way it can be done ?
OK, we can replicate that chart in Kibana, here's what you need to do.
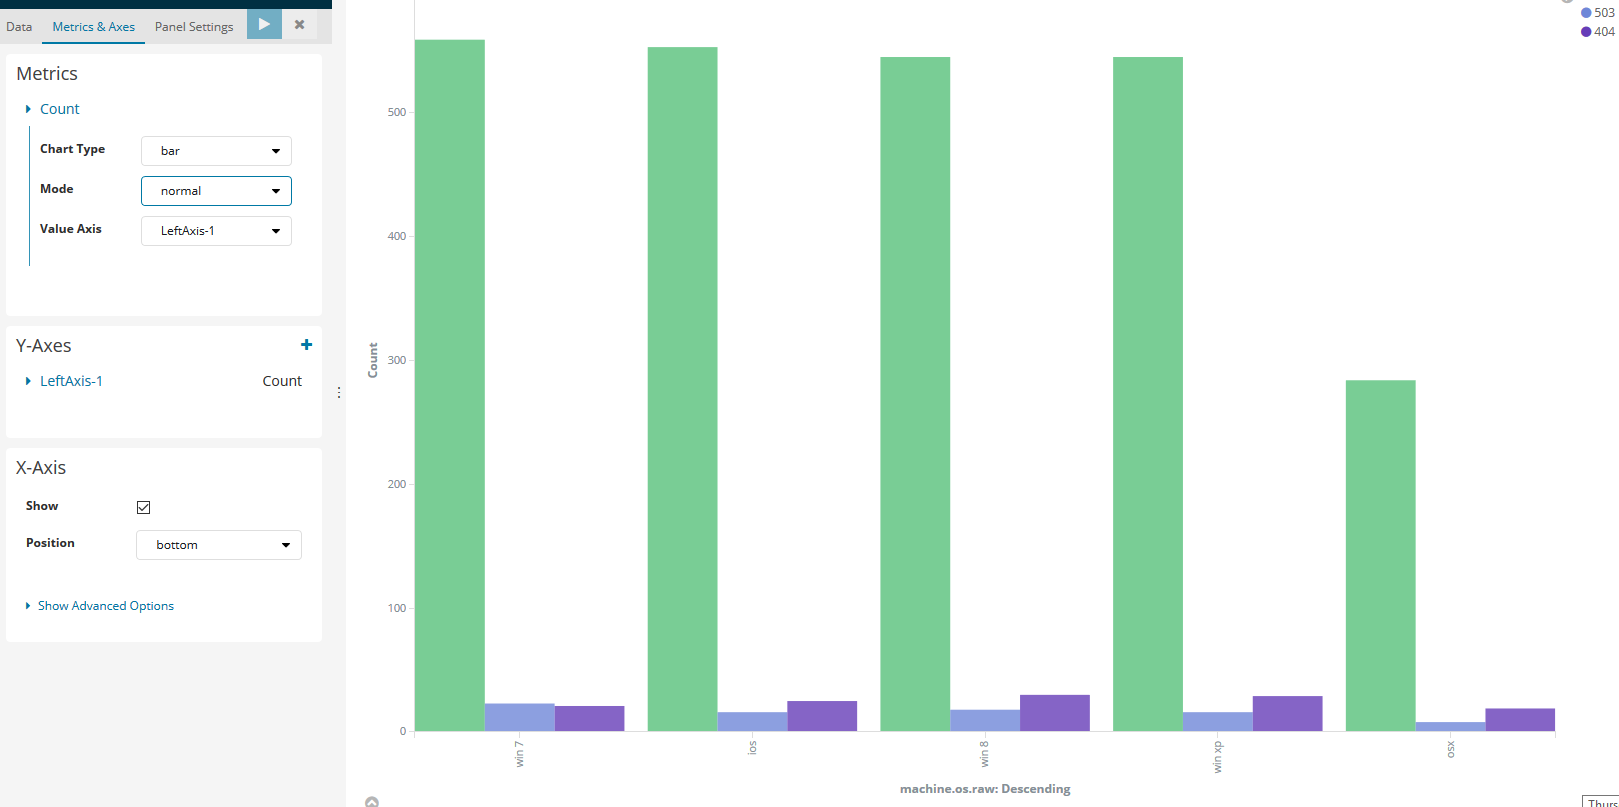
First, the Y-axis where you want to display the height, we can use a "Max" of the "height field.
Now, on the X-axis, we do a "Terms" aggregation on the "Name" field.
Then we do a Split Series on the "year" field and set the Mode of the X-axis in the "Metrics and Axis" tab to Normal instead of Stacked.
I did something similar with some dummy Apache log data:
But keep in mind, in this setup I assumed a data structure like this:
{ name: Albert, year: 2015, height: 150}, { name: Albert, year: 2016, height: 160} and so on.
Apache, Apache Lucene, Apache Hadoop, Hadoop, HDFS and the yellow elephant
logo are trademarks of the
Apache Software Foundation
in the United States and/or other countries.