I am currently using Elastic-Agent for log collection and Logstash for log forwarding. I am conducting a stress test to evaluate the hardware requirements and costs of the collector setup (Elastic-Agent + Logstash). I have set the Logstash batch size to 1000.
Apache JMeter (192.168.3.170) -> Elastic-Agent [Fortigate] (192.168.3.172:515) -> Logstash (192.168.3.172:5044) -> Elasticsearch (8 Core/16 GB RAM/512 GB SSD)
input {
  elastic_agent {
    port => 5044
    ssl_enabled => true
    ssl_certificate_authorities => ["/etc/logstash/certs/elasticsearch-ca.pem"]
    ssl_certificate => "/etc/logstash/certs/logstash.crt"
    ssl_key => "/etc/logstash/certs/logstash.pkcs8.key"
    ssl_client_authentication => "required"
  }
}

filter {
  grok {
    match => { "message" => "%{SYSLOGTIMESTAMP:syslog_timestamp} %{IP:syslog_ip} %{GREEDYDATA:message}" }
    overwrite => ["message"]
  }


  mutate {
    remove_field => ["syslog_timestamp", "syslog_ip"]
  }


  if [message] =~ /type="utm" subtype="ips"/ or [message] =~ /type="event" subtype="system"/ {
    mutate {
      add_tag => ["send_to_QRadar"]
    }
  } else {
    mutate {
      add_tag => ["send_to_elasticsearch"]
    }
  }
}

output {


  if "send_to_QRadar" in [tags] {
    tcp {
      host => "192.168.3.180"
      port => 514
      codec => line {
        format => "%{message}"
      }
    }
  }
  if "send_to_elasticsearch" in [tags] {
    elasticsearch {
      hosts => ["https://192.168.3.171:9200"]
      data_stream => "true"
      user => "elastic"
      password => "password"
      cacert => "/etc/logstash/certs/elasticsearch-ca.pem"
    }
  }
}
At 10,000 EPS during the stress test, using the configuration above, the Logstash monitoring curve becomes unstable, holding at approximately 6,000-7,000 EPS.

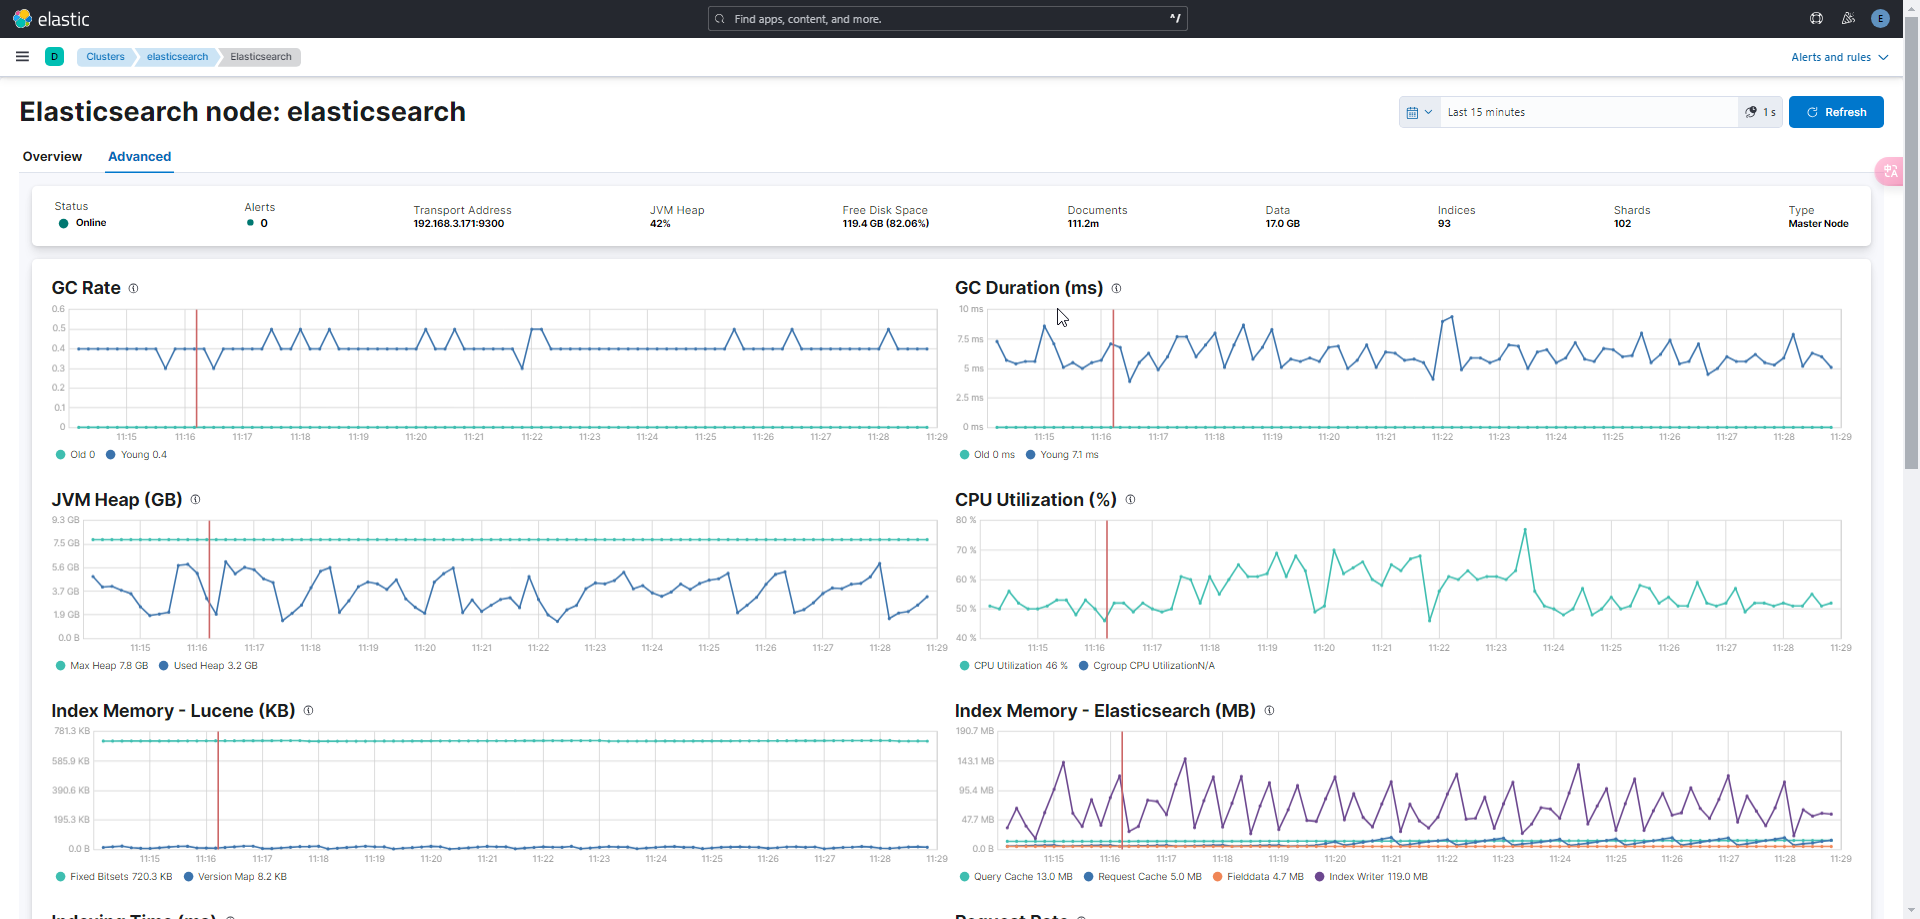
I suspect the issue might be with Elasticsearch. However, after reviewing the monitoring data, there’s no sign of excessive CPU or RAM usage on Elasticsearch. I also checked the I/O statistics using iostat, and it doesn’t seem to be an I/O issue either.


When I change the output to null, the Logstash monitoring curve stabilizes at around 10,000 EPS.
Apache JMeter (192.168.3.170) -> Elastic-Agent [Fortigate] (192.168.3.172:515) -> Logstash (192.168.3.172:5044) -> Output Null
output {
  null {}
}

Does anyone have insights into what could be causing this problem?