Hi,
I try to config remote monitoring to my production elk cluster... so I first install metricbeat and then config to ouput to remote monitoring Elasticsearch. I use module Elasticsearch-xpack and kibana-xpack.. I can see new data in .monitoring-* on monitoring cluster, but I can't see dashboard of stack monitoring... please someone can help... Thanks
Have you gone through the troubleshooting monitoring documentation? Do you see any errors in the browser developer console?
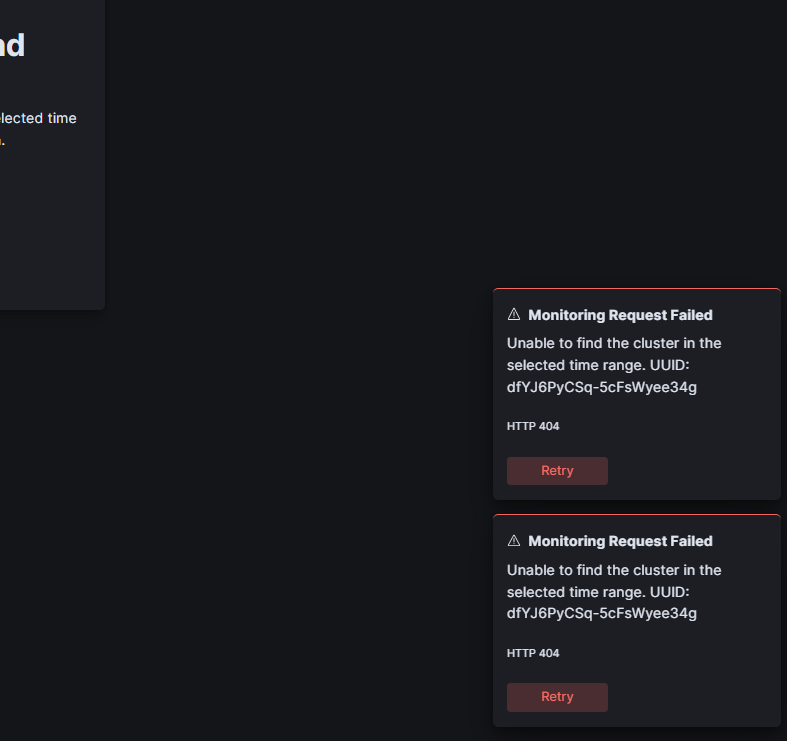
HI, yes I follow this... what that I figure out is when I press on stack monitoring in kibana , I see screen (PIC 1.jpg ). when I press on "Set up monitoring Metricbeat" I get this error (pic2.jpg) - error on not find "Unable to find the cluster in the selected time range. UUID: dfYJ6PyCSq-5cFsWyee34g".
monitoring cluster UUID : dfYJ6PyCSq-5cFsWyee34g PROD Cluster UUID : pF1Y5SWNRRKQPY-csButQg

I data in index .monitoring-es-7-* which store on the monitor cluster is (pic 3)

Thanks on your help
Seems your monitoring cluster is looking for data about itself right? In your screenshot the UI complains about not finding data from dfY... but it should look for data from pF1Y....
Sorry for not being of much help, I'm not familiar with the monitoring configuration to help you further ![]()
Yes, this the problem... Do you know who can help ?