irobot678
August 14, 2019, 11:25am
1
Hi,
The highlighted area shows my heap-size as 1.4gb in the kibana heap ss (screenshot below).
How do i increase or decrease it ?
and it is different jvm.options in elasticsearch.yml
Please help me solve it.
kibana heap ss :
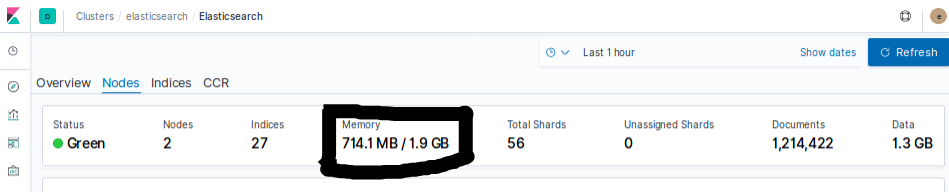
elastic heap ss : which is 1.9 (~2gb so its verified)
Hi @irobot678 ,
You can try setting the v8 option --max_old_space_size. See https://github.com/nodejs/node/issues/7937
irobot678
August 14, 2019, 1:56pm
3
Hi @chrisronline ,
Thanks for the reply !
But changing the heap for kibana does it really help improving its performance.
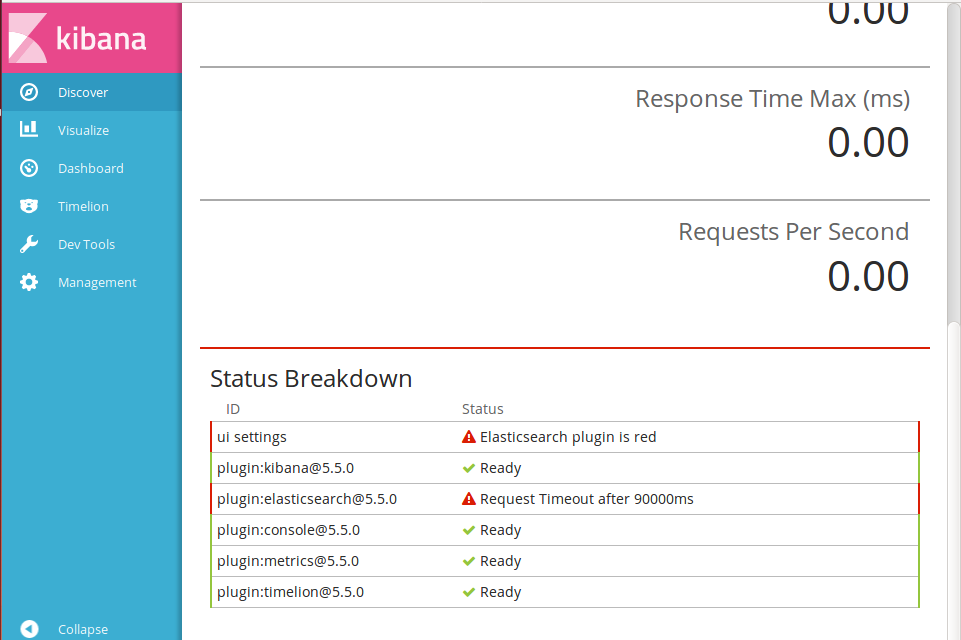
and can we avoid these request timeout errors and status red errors by increasing the heap.
these request timeout errors and status red errors by increasing the heap.
Can you share these error messages?
irobot678
August 14, 2019, 2:10pm
5
sure ,
we already changed the request timeout from 30000ms to 90000ms now we are able get results for a week of data but not for the whole month.
so we are thinking to change the heap size so that it may help us avoiding these kind of errors.
and also can you please help me understand what are heap values related to? is it kibana heap or elastic search heap ?
Are you seeing errors in the Elasticsearch log? I'd assume the issue isn't with Kibana, but on the Elasticsearch side
Hi Vamsi,
irobot678
August 14, 2019, 4:22pm
8