Hi
I want to create a vertical bar chart visualisation where I count the number of events depending to event timestamp, and I notice a behavior that does not understand.
My event time field is called ACT_HEURE_ACTIVITE.
My time dimension spreads from 2th of may 00:00:00 to 3th of may 00:00:00.
When I set my Y-axis agregation to Count Kibana returns 102 ivents. Same if I change to Unique count using INC_ID field (which is a unique ID).
When I let my Y-axis agregation to Count mode and set my X-axis to Date Histogram using ACT_HEURE_ACTIVITE and daily interval, Kibana still returns 102 events.
What count does the Discover tab show for that time range? I think that would be the most accurate count of docs since it isn't doing any aggregations.
So it seems you must have 102 documents in that time range.
But it seems that either 3 documents have the same INC_ID, or 2 pairs of documents have the same INC_ID such that there's only 100 unique INC_IDs. On the Discover tab you could add the INC_ID field to the table and sort by that to try to see the duplicates.
And I change the Y-axis field to ACT_HEURE_ACTIVITE Kibana returns 103 events !
You don't show a screen shot of this last combination. I don't know why you would see a count of 103. But I can't think of any reason to use the timestamp on both the X and Y Axis.
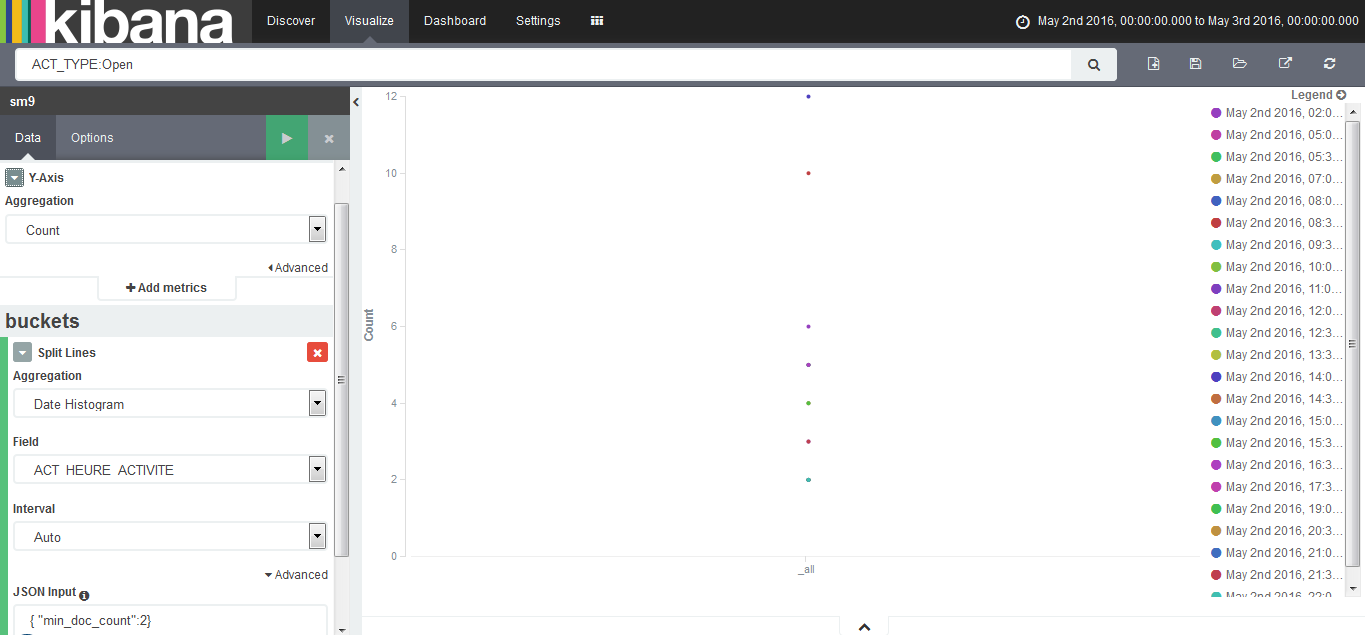
Another way to find the duplicates might be to follow the example in this screen shot and put JSON in the advanced JSON Input field (except you would use { "min_doc_count":2} and that should show you only the duplicate INC_IDs.
I added the INC_ID field in Discover tab and exported data to Excel (copy-paste values). My sheet containts 102 lines. When I remove duplicates on INC_ID column I also obtain 102 distinct values.
Your last screenshot has a time range of 'Last 60 days'. I think you meant for that to be only the 2nd of May 2016. Do you get 324 if you set it to only that day?
I don't see the precision_thresholdspecified in the request for a visualization with unique count used so I guess it uses the default. The default value is described here, but don't make complete sense to me;
Default value depends on the number of parent aggregations that multiple create buckets (such as terms or histograms).
I also tried a test with test data I had, and when I charted unique count of a time field I also got many more results than I expected. But then I found that the time field represented an array and some docs had multiple time values in them.
Apache, Apache Lucene, Apache Hadoop, Hadoop, HDFS and the yellow elephant
logo are trademarks of the
Apache Software Foundation
in the United States and/or other countries.