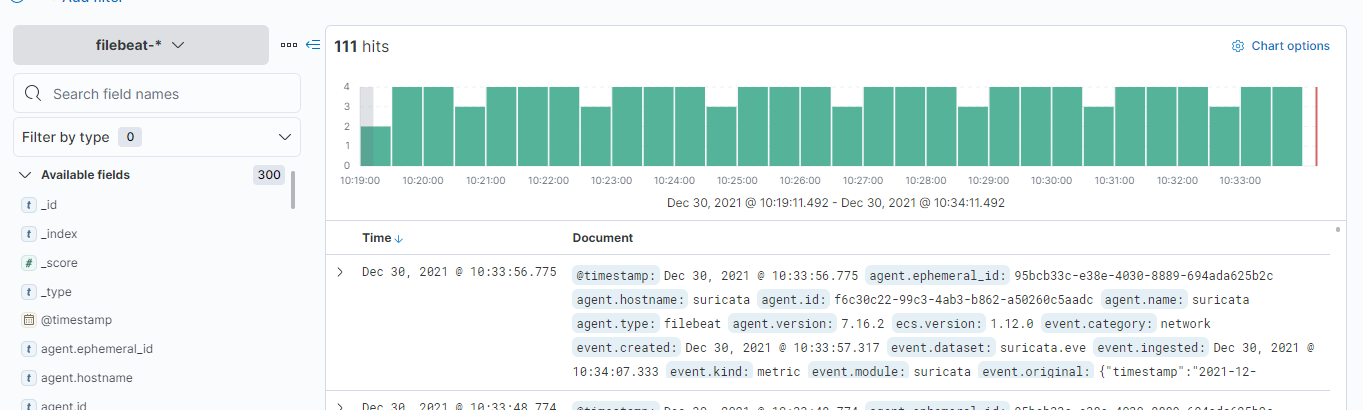
So Far this is the result I am seeing when I go to discover and select filebeat index there
<"timestamp":"2022-01-04T19:31:59.384597+0500","event_type":"stats","stats":{"uptime":542089,"capture":{"kernel_packets":2,"kernel_drops":0,"errors":0},"decoder":{"pkts":2,"bytes":120,"invalid":0,"ipv4":2,"ipv6":0,"ethernet":2,"raw":0,"null":0,"sll":0,"tcp":0,"udp":0,"sctp":0,"icmpv4":0,"icmpv6":0,"ppp":0,"pppoe":0,"geneve":0,"gre":0,"vlan":0,"vlan_qinq":0,"vxlan":0,"ieee8021ah":0,"teredo":0,"ipv4_in_ipv6":0,"ipv6_in_ipv6":0,"mpls":0,"avg_pkt_size":60,"max_pkt_size":60,"erspan":0,"event":{"ipv4":{"pkt_too_small":0,"hlen_too_small":0,"iplen_smaller_than_hlen":0,"trunc_pkt":0,"opt_invalid":0,"opt_invalid_len":0,"opt_malformed":0,"opt_pad_required":2,"opt_eol_required":0,"opt_duplicate":0,"opt_unknown":0,"wrong_ip_version":0,"icmpv6":0,"frag_pkt_too_large":0,"frag_overlap":0,"frag_ignored":0},"icmpv4":{"pkt_too_small":0,"unknown_type":0,"unknown_code":0,"ipv4_trunc_pkt":0,"ipv4_unknown_ver":0},"icmpv6":{"unknown_type":0,"unknown_code":0,"pkt_too_small":0,"ipv6_unknown_version":0,"ipv6_trunc_pkt":0,"mld_message_with_invalid_hl":0,"unassigned_type":0,"experimentation_type":0},"ipv6":{"pkt_too_small":0,"trunc_pkt":0,"trunc_exthdr":0,"exthdr_dupl_fh":0,"exthdr_useless_fh":0,"exthdr_dupl_rh":0,"exthdr_dupl_hh":0,"exthdr_dupl_dh":0,"exthdr_dupl_ah":0,"exthdr_dupl_eh":0,"exthdr_invalid_optlen":0,"wrong_ip_version":0,"exthdr_ah_res_not_null":0,"hopopts_unknown_opt":0,"hopopts_only_padding":0,"dstopts_unknown_opt":0,"dstopts_only_padding":0,"rh_type_0":0,"zero_len_padn":0,"fh_non_zero_reserved_field":0,"data_after_none_header":0,"unknown_next_header":0,"icmpv4":0,"frag_pkt_too_large":0,"frag_overlap":0,"frag_ignored":0,"ipv4_in_ipv6_too_small":0,"ipv4_in_ipv6_wrong_version":0,"ipv6_in_ipv6_too_small":0,"ipv6_in_ipv6_wrong_version":0},"tcp":{"pkt_too_small":0,"hlen_too_small":0,"invalid_optlen":0,"opt_invalid_len":0,"opt_duplicate":0},"udp":{"pkt_too_small":0,"hlen_too_small":0,"hlen_invalid":0},"sll":{"pkt_too_small":0},"ethernet":{"pkt_too_small":0},"ppp":{"pkt_too_small":0,"vju_pkt_too_small":0,"ip4_pkt_too_small":0,"ip6_pkt_too_small":0,"wrong_type":0,"unsup_proto":0},"pppoe":{"pkt_too_small":0,"wrong_code":0,"malformed_tags":0},"gre":{"pkt_too_small":0,"wrong_version":0,"version0_recur":0,"version0_flags":0,"version0_hdr_too_big":0,"version0_malformed_sre_hdr":0,"version1_chksum":0,"version1_route":0,"version1_ssr":0,"version1_recur":0,"version1_flags":0,"version1_no_key":0,"version1_wrong_protocol":0,"version1_malformed_sre_hdr":0,"version1_hdr_too_big":0},"vlan":{"header_too_small":0,"unknown_type":0,"too_many_layers":0},"ieee8021ah":{"header_too_small":0},"ipraw":{"invalid_ip_version":0},"ltnull":{"pkt_too_small":0,"unsupported_type":0},"sctp":{"pkt_too_small":0},"mpls":{"header_too_small":0,"pkt_too_small":0,"bad_label_router_alert":0,"bad_label_implicit_null":0,"bad_label_reserved":0,"unknown_payload_type":0},"geneve":{"unknown_payload_type":0},"erspan":{"header_too_small":0,"unsupported_version":0,"too_many_vlan_layers":0},"dce":{"pkt_too_small":0}},"too_many_layers":0},"flow":{"memcap":0,"tcp":0,"udp":0,"icmpv4":0,"icmpv6":0,"spare":10000,"emerg_mode_entered":0,"emerg_mode_over":0,"tcp_reuse":0,"memuse":7474304},"defrag":{"ipv4":{"fragments":0,"reassembled":0,"timeouts":0},"ipv6":{"fragments":0,"reassembled":0,"timeouts":0},"max_frag_hits":0},"flow_bypassed":{"local_pkts":0,"local_bytes":0,"local_capture_pkts":0,"local_capture_bytes":0,"closed":0,"pkts":0,"bytes":0},"tcp":{"sessions":0,"ssn_memcap_drop":0,"pseudo":0,"pseudo_failed":0,"invalid_checksum":0,"no_flow":0,"syn":0,"synack":0,"rst":0,"midstream_pickups":0,"pkt_on_wrong_thread":0,"segment_memcap_drop":0,"stream_depth_reached":0,"reassembly_gap":0,"overlap":0,"overlap_diff_data":0,"insert_data_normal_fail":0,"insert_data_overlap_fail":0,"insert_list_fail":0,"memuse":2867200,"reassembly_memuse":491520},"detect":{"engines":[{"id":0,"last_reload":"2021-12-29T12:57:25.630866+0500","rules_loaded":23330,"rules_failed":0}],"alert":0},"app_layer":{"flow":{"http":0,"ftp":0,"smtp":0,"tls":0,"ssh":0,"imap":0,"smb":0,"dcerpc_tcp":0,"dns_tcp":0,"nfs_tcp":0,"ntp":0,"ftp-data":0,"tftp":0,"ikev2":0,"krb5_tcp":0,"dhcp":0,"snmp":0,"failed_tcp":0,"dcerpc_udp":0,"dns_udp":0,"nfs_udp":0,"krb5_udp":0,"failed_udp":0},"tx":{"http":0,"ftp":0,"smtp":0,"tls":0,"ssh":0,"imap":0,"smb":0,"dcerpc_tcp":0,"dns_tcp":0,"nfs_tcp":0,"ntp":0,"ftp-data":0,"tftp":0,"ikev2":0,"krb5_tcp":0,"dhcp":0,"snmp":0,"dcerpc_udp":0,"dns_udp":0,"nfs_udp":0,"krb5_udp":0},"expectations":0},"flow_mgr":{"closed_pruned":0,"new_pruned":0,"est_pruned":0,"bypassed_pruned":0,"flows_checked":0,"flows_notimeout":0,"flows_timeout":0,"flows_timeout_inuse":0,"flows_removed":0,"rows_checked":65536,"rows_skipped":65536,"rows_empty":0,"rows_busy":0,"rows_maxlen":0},"http":{"memuse":0,"memcap":0},"ftp":{"memuse":0,"memcap":0},"file_store":{"open_files":0}}}/>