Hi!
Given the following example dataset showing the number of warnings in C++ files for a given date, and also containing information about which project each C++ file belongs to:
{ "file": "a.cpp", "project": "foo", "warnings": 123, "@timestamp": "2018-12-28 00:00"}
{ "file": "a.cpp", "project": "bar", "warnings": 123, "@timestamp": "2018-12-28 00:00"}
{ "file": "b.cpp", "project": "bar", "warnings": 12, "@timestamp": "2018-12-28 00:00"}
{ "file": "c.cpp", "project": "foo", "warnings": 321, "@timestamp": "2018-12-28 00:00"}

{ "file": "a.cpp", "project": "foo", "warnings": 12, "@timestamp": "2018-12-29 00:00"}
{ "file": "a.cpp", "project": "bar", "warnings": 12, "@timestamp": "2018-12-29 00:00"}
{ "file": "b.cpp", "project": "bar", "warnings": 1, "@timestamp": "2018-12-29 00:00"}
{ "file": "c.cpp", "project": "foo", "warnings": 32, "@timestamp": "2018-12-29 00:00"}
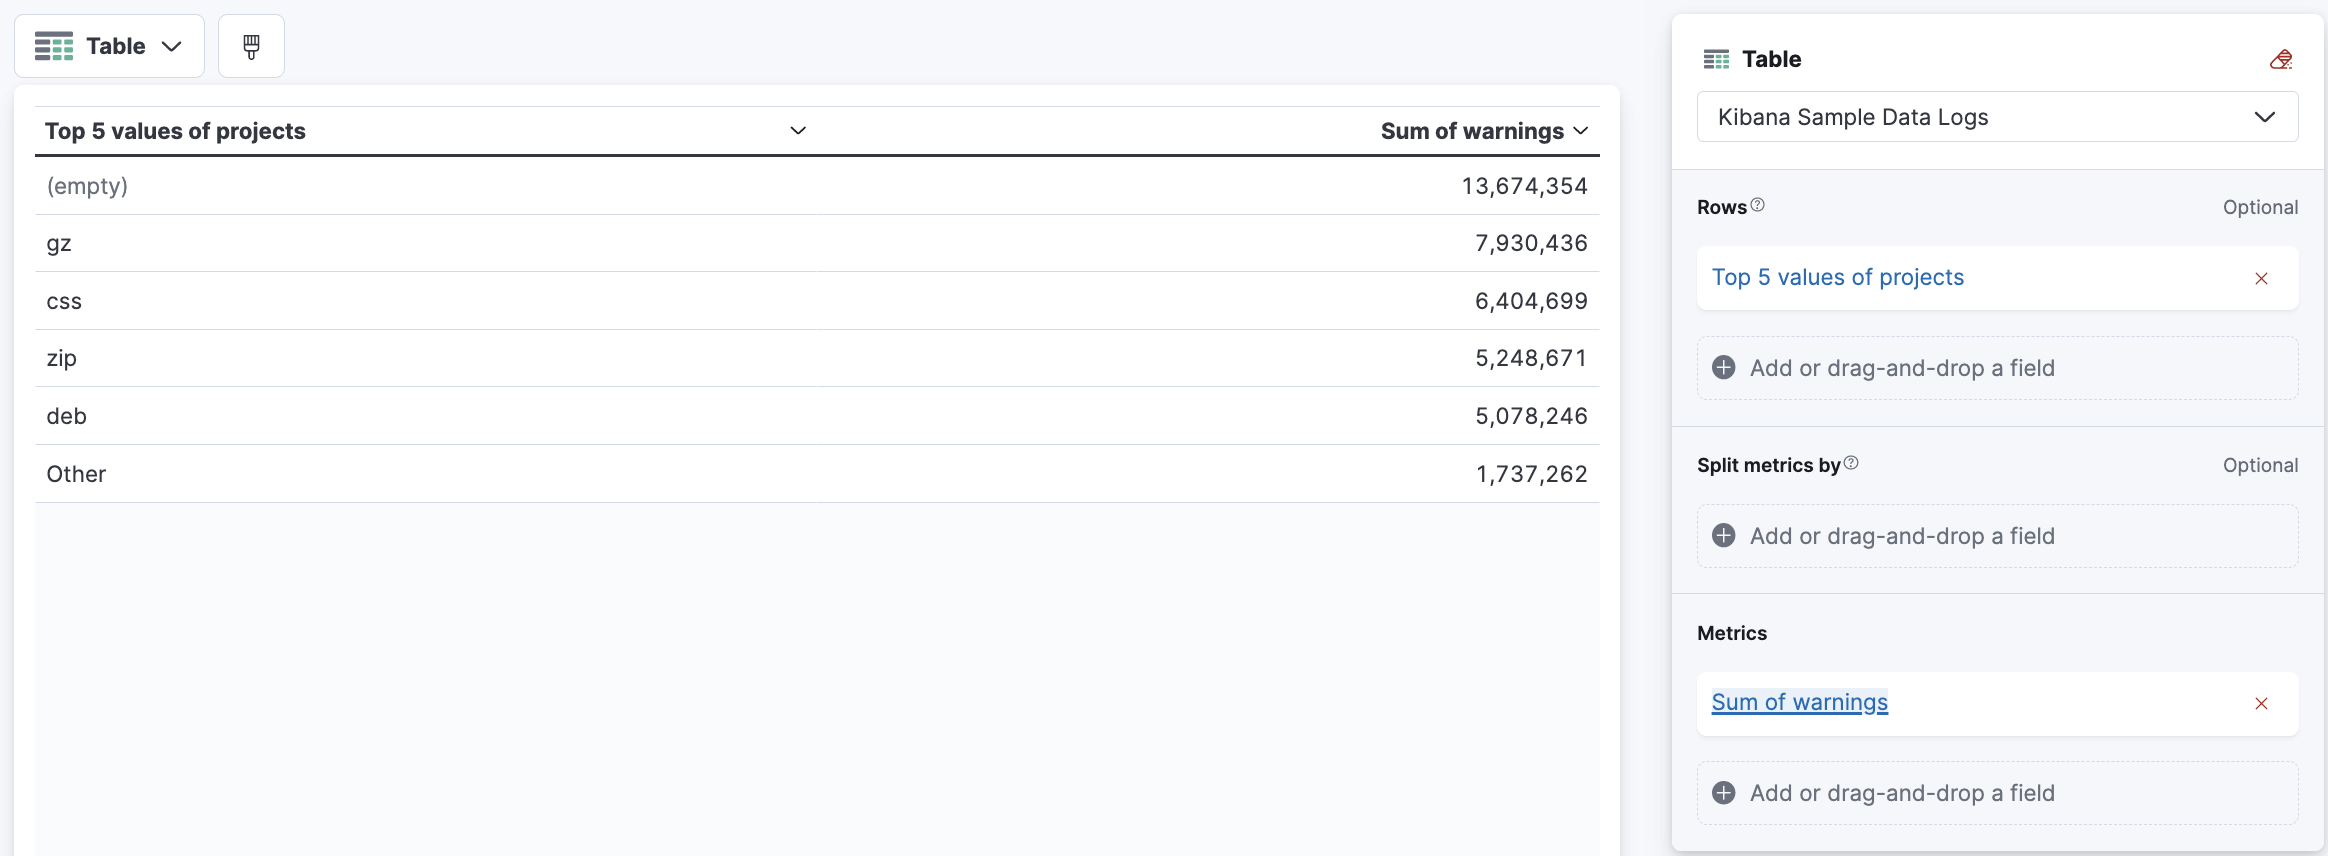
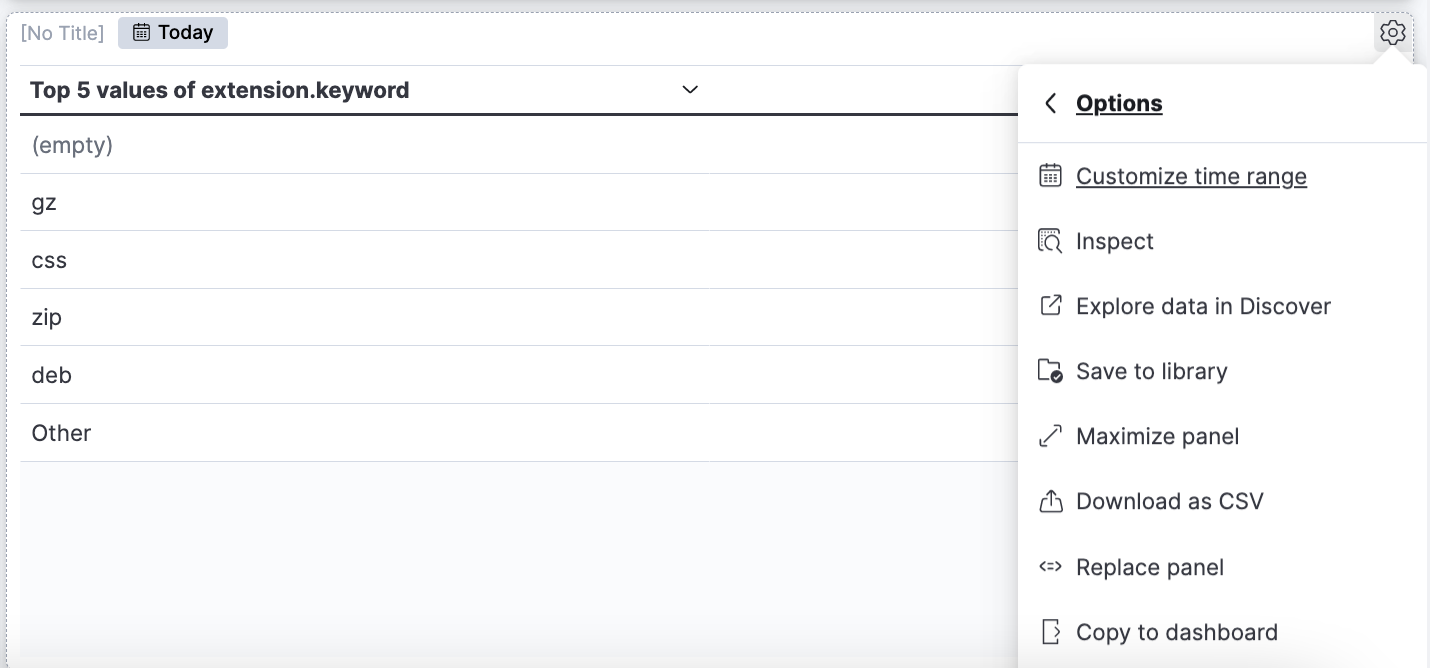
I want to create a Table in Kibana that summarizes the aggregated number of warnings for each project, for the latest timestamp (to get a quick overview of the status and be able to e.g. prioritize what to work on next):
Project name                         |    Total number of warnings on latest day
-----------------------------------------------------------------------------------------------------
foo                                  |    12 + 32 = 44
-----------------------------------------------------------------------------------------------------
bar                                  |    12 + 1 = 13
I believe my example is very similar to this one, where the answer is that the visualization should be done in Vega instead. But in this case there's no support for tables in Vega, so is there really no way at all to accomplish this?