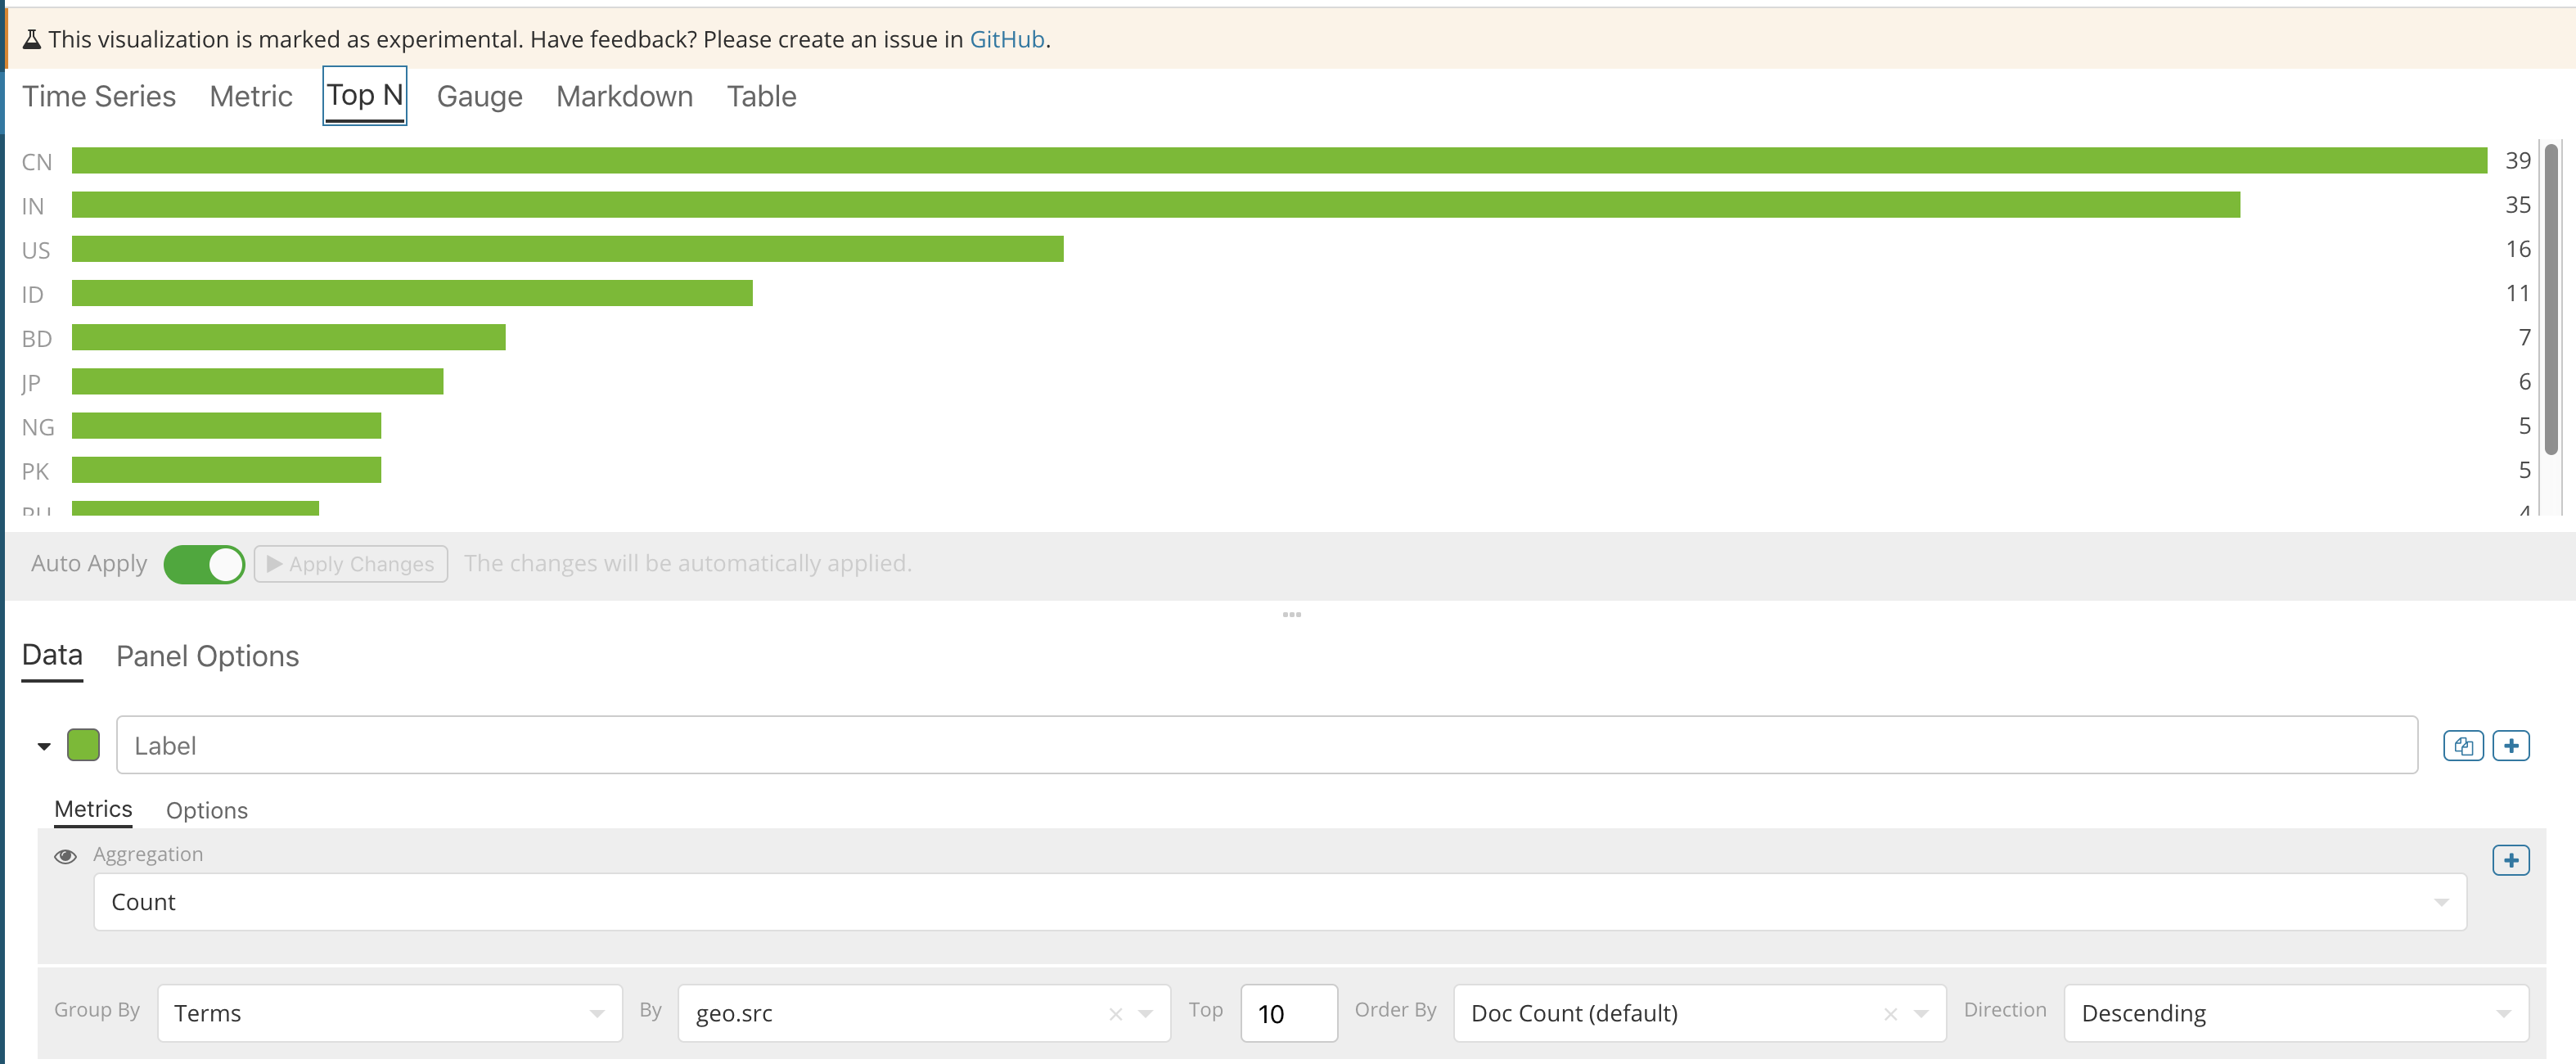
I've had various issues with the Top N displaying properly for the Visual Builder. On versions previous to 6.2.2, it would count the total instances but not always sort them in descending order. Currently, this is what I have going on:
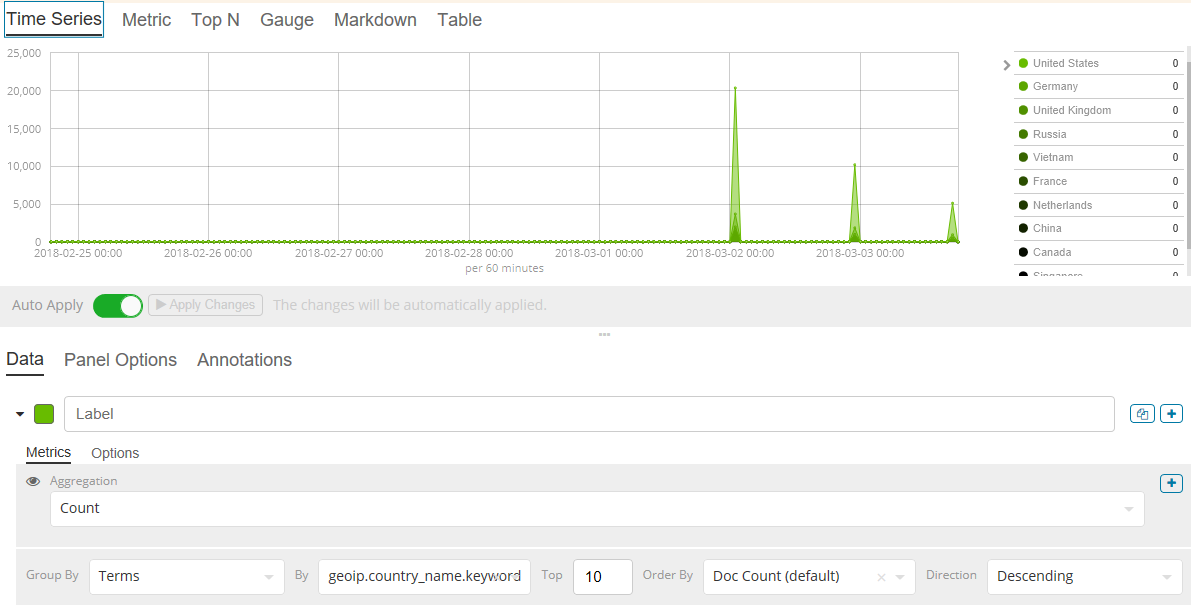
The term being grouped is geoip.country_name.keyword. As you can see, it's showing zero across the board but if I build it via a table, as shown below, there are definitely values that can be counted. What am I doing wrong here?
The way that Time Series Visual Builder works is different than a Data Table Visualization, because in TSVB, everything starts with a histogram that uses a time interval from a timestamp field.
It's easier to understand if you start from the "Time Series" chart. I made a chart with server logs and put it into a chart.
The terms here are just a "blown up" view of the terms shown in the last time bucket of the Time Series chart.
If you're getting only zeroes for the Top N chart, take a look at what the data looks like in the Time Series view. The time range could be expanded in a way that makes the last time bucket have zero counts for terms that exist in earlier time buckets.
If I then switch to Top N, I get all zeros. If I refine the time frame to a small slice that has no zeros, then I get values in Top N. So I guess what I am trying to accomplish is a Top 10 of countries that appear in a given time. I like the vertical bar graph the TSVB provides, does one of the other visualizations more appropriately fit my needs/desires?
OK, one more question. With the TSVB, I could link the each Top N entry. I don't see the ability to do that with the Horizontal Bar visualization. Is there a way or different visualization that will give me that functionality as well?
Sorry, that does not work for the "core" visualization types when the value to format is in the legend of a chart.
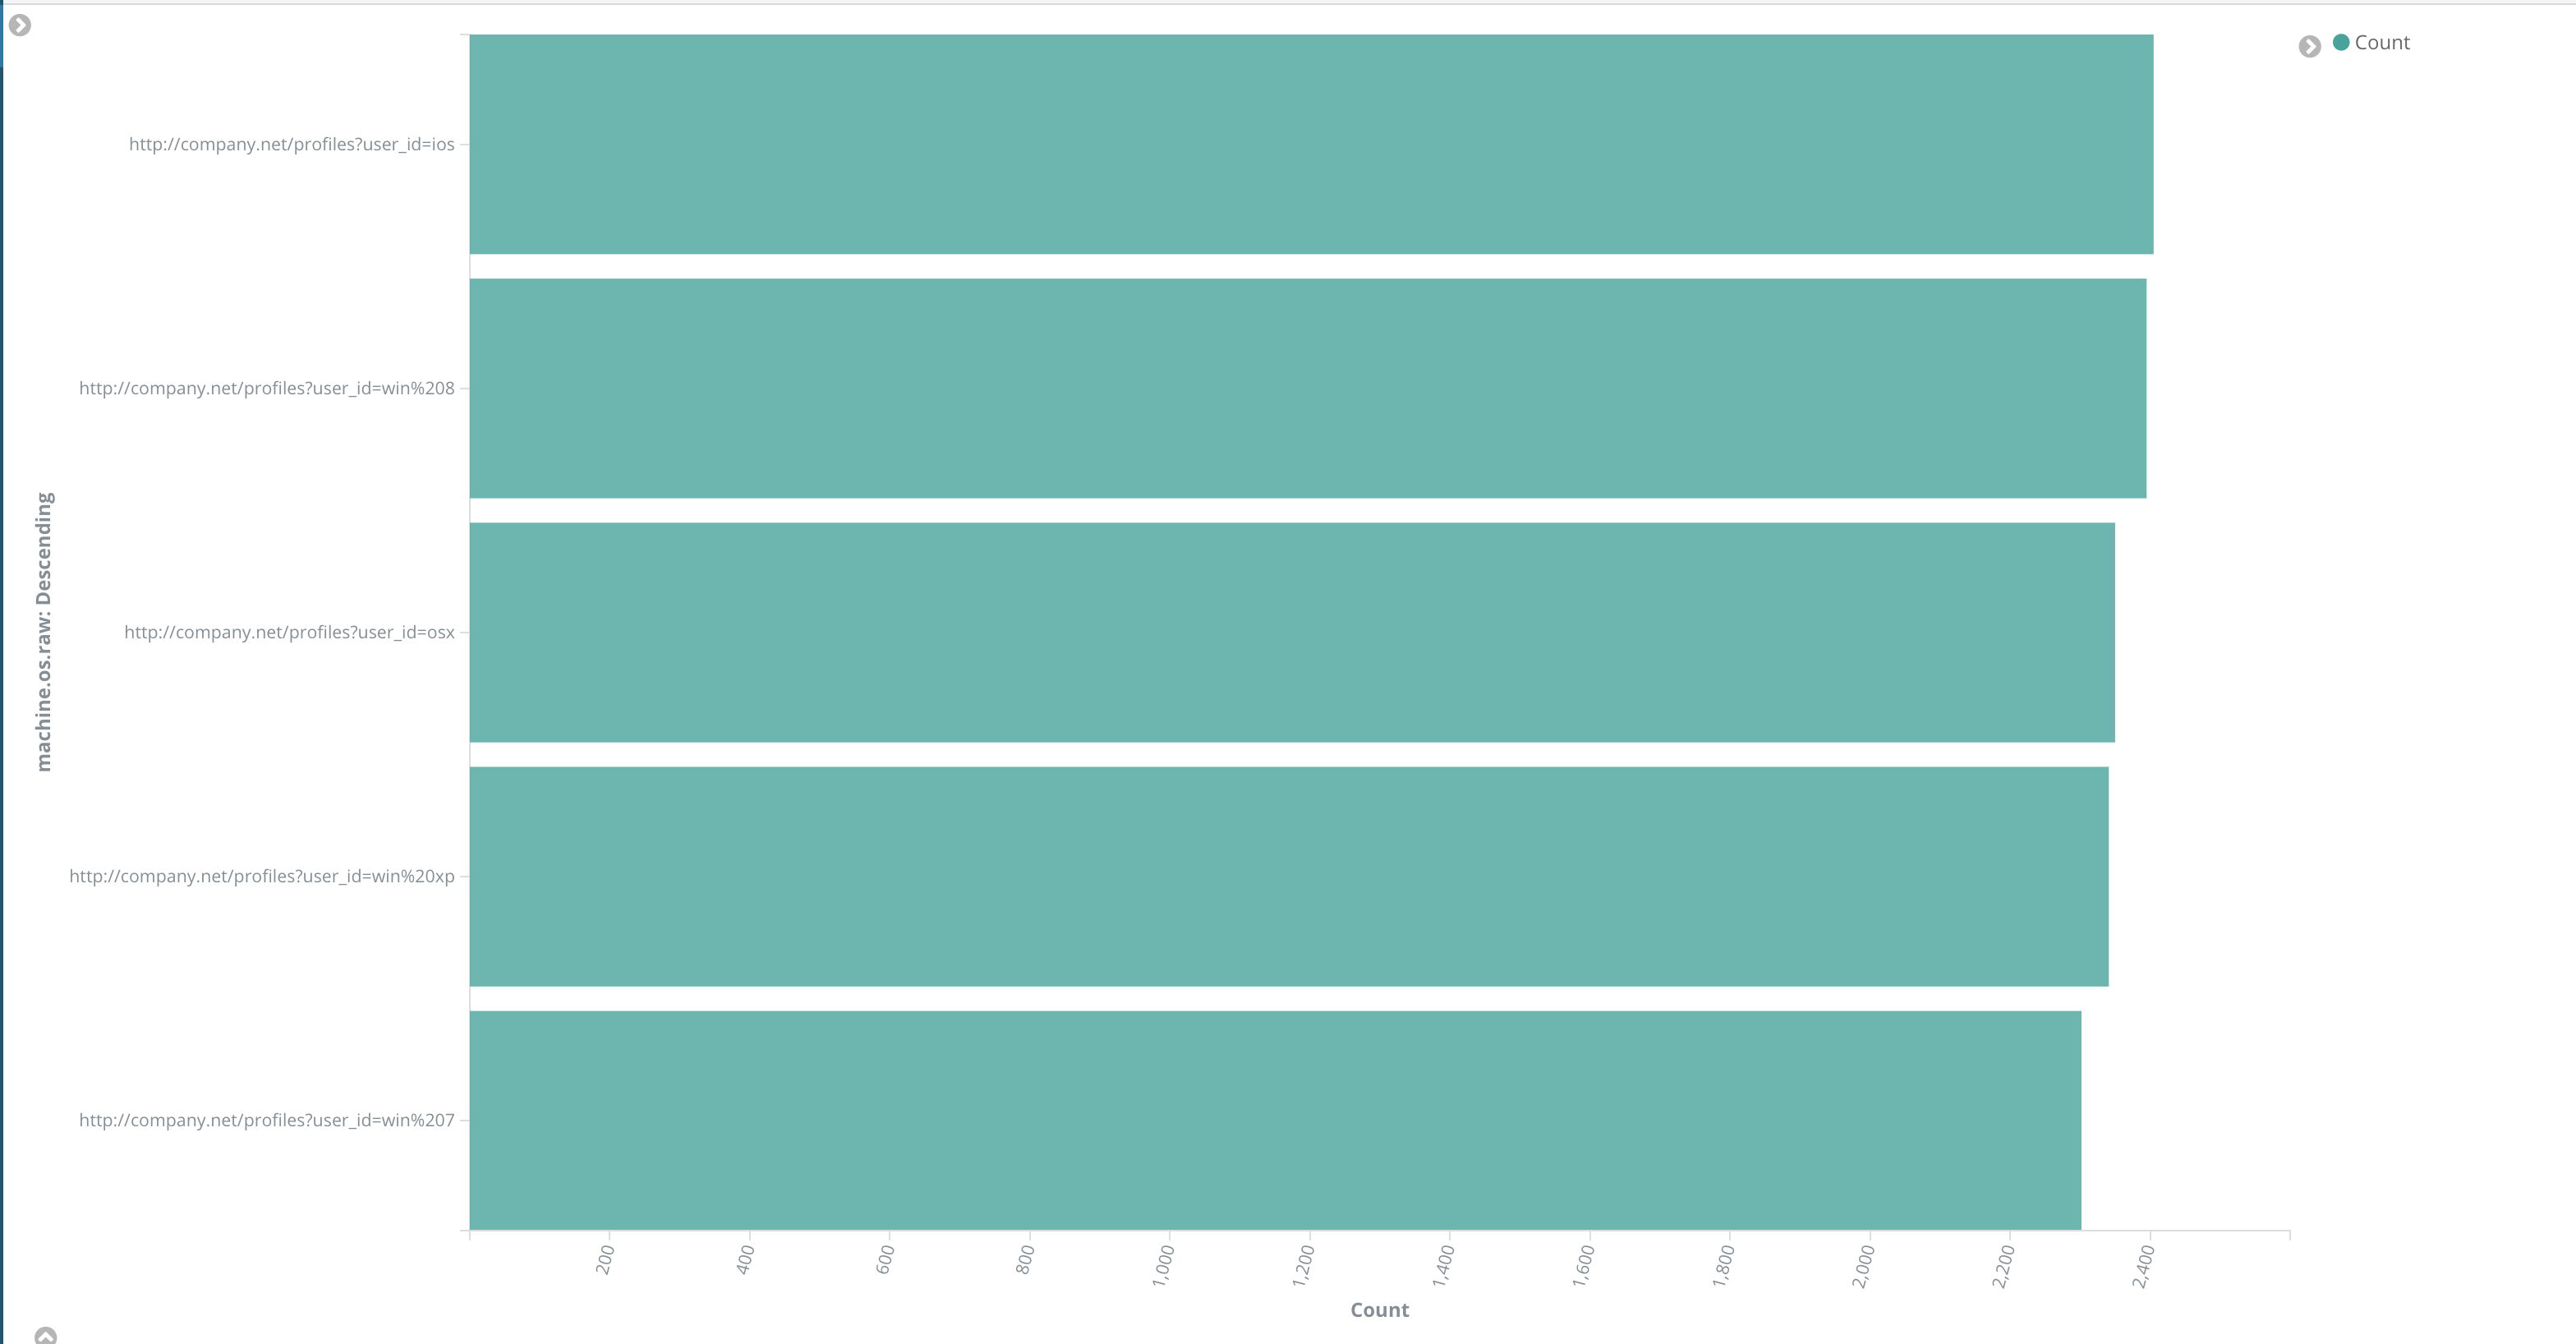
You can add a field formatter to an index pattern to have Kibana format the field how you want whenever it is displayed, but when it gets formatted in a legend, there is no clickable link:
The best I could get is something that looks like this:
Apache, Apache Lucene, Apache Hadoop, Hadoop, HDFS and the yellow elephant
logo are trademarks of the
Apache Software Foundation
in the United States and/or other countries.