Traces are not shown in Kibana

Kibana version: 7.15.2

Elasticsearch version: 7.16.3

APM Server version: 7.16.3

APM Agent language and version: Java 11, agent version: 1.28.4

Browser version: Google chrome 97.0.4692.99

**Description: I am trying to instrument my Java web application running on tomcat which deployed in docker container, I installed APM server, Elasticsearch and Kibana in docker. I configured Java application using following properties:
-javaagent:/usr/local/app/bin/elastic-apm-agent-1.28.4.jar -Delastic.apm.service_name=my-application -Delastic.apm.server_url=http://localhost:8200

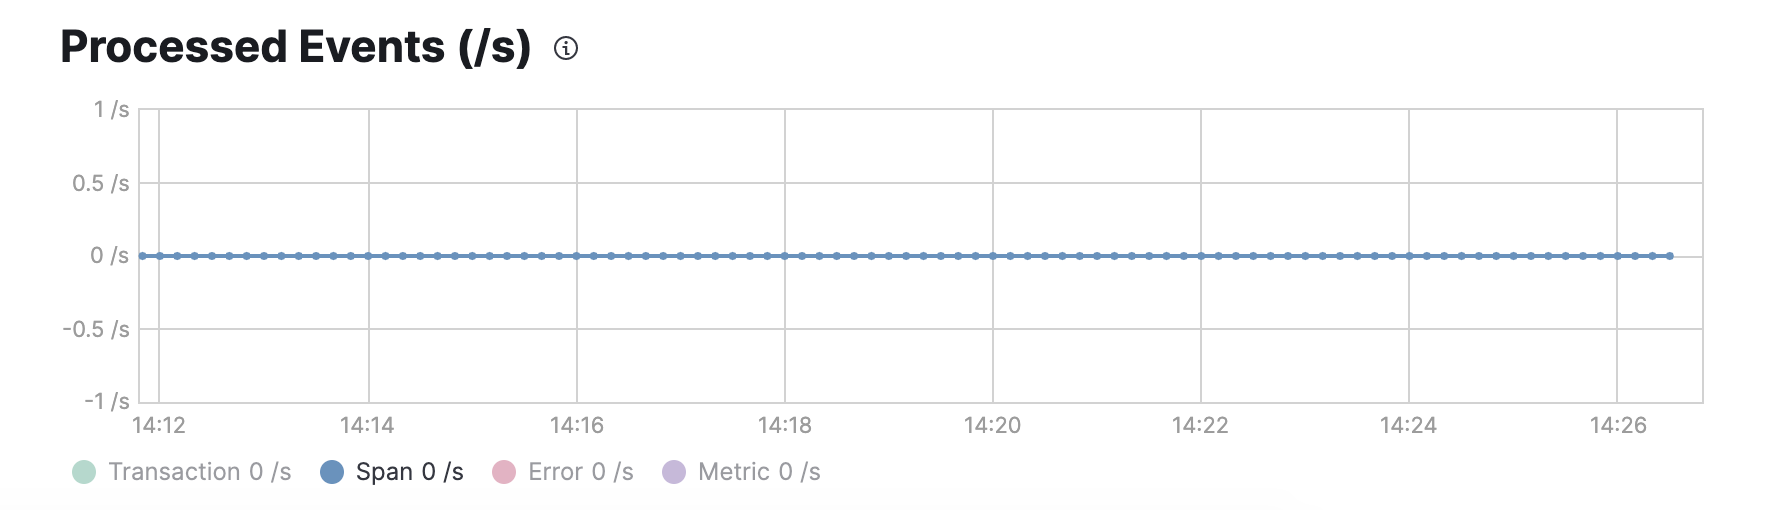
It seems that, traces is running and application is able to communicate with APM server:

server_url: 'http://192.168.1.3:8200' (source: Java System Properties)
2022-01-29 16:00:14,092 [main] INFO  co.elastic.apm.agent.configuration.StartupInfo - application_packages: 'com.santaba.reporting.dataengine.alertthresholdv3' (source: Java System Properties)
2022-01-29 16:00:16,086 [main] INFO  co.elastic.apm.agent.impl.ElasticApmTracer - Tracer switched to RUNNING state
2022-01-29 16:00:16,118 [elastic-apm-server-healthcheck] INFO  co.elastic.apm.agent.report.ApmServerHealthChecker - Elastic APM server is available: {  "build_date": "2022-01-06T23:13:12Z",  "build_sha": "fde0af4fa2b9f39e518b333c5be56cf8be215ca0",  "publish_ready": true,  "version": "7.16.3"}

But in Kibana APM agent is not in active state

Logs from APM server:

{"log.level":"info","@timestamp":"2022-01-29T22:06:33.901+0530","log.logger":"request","log.origin":{"file.name":"middleware/log_middleware.go","file.line":63},"message":"not modified","service.name":"apm-server","url.original":"/config/v1/agents","http.request.method":"POST","user_agent.original":"apm-agent-java/1.28.4 (my-application)","source.address":"192.168.1.3","http.request.body.bytes":513,"http.request.id":"e2e7a34f-f2f7-47f4-9864-d5813a4ee6f5","event.duration":18301071,"http.response.status_code":304,"ecs.version":"1.6.0"}

{"log.level":"info","@timestamp":"2022-01-29T22:06:43.509+0530","log.logger":"request","log.origin":{"file.name":"middleware/log_middleware.go","file.line":63},"message":"request accepted","service.name":"apm-server","url.original":"/intake/v2/events","http.request.method":"POST","user_agent.original":"apm-agent-java/1.28.4 (my-application)","source.address":"192.168.1.3","http.request.id":"4536dbfe-4c77-4094-8acf-b7453f9e9ba3","event.duration":9998567640,"http.response.status_code":202,"ecs.version":"1.6.0"}

Hey,

Could you check a couple things for us?

  1. Can you check to see that your events were sent from the apm-server to Elasticsearch? You can do this by going to the Console in kibana and checking to see if any transactions are present: GET apm-7.16.3-transaction*/_search. The response should include hits.total.value, which shows how many transactions were indexed into Elasticsearch.
  2. Could you also send us the index mappings? You can query this also from the Console: GET apm*/_mapping
  3. Lastly, could you provide us with a .har file?

@stuart.nelson Thanks for your reply, Below are details:

  1. When I

GET _cat/indices/apm-*

, I get below response:

  1. When I

GET apm-7.16.3-transaction*/_search

, get below response:

{
    "took": 1,
    "timed_out": false,
    "_shards": {
        "total": 1,
        "successful": 1,
        "skipped": 0,
        "failed": 0
    },
    "hits": {
        "total": {
            "value": 0,
            "relation": "eq"
        },
        "max_score": null,
        "hits": []
    }
}

I am not aware about .har file, could you please inform me, where can I find this file.

It is ambiguous why my transaction data is not ingested in Elasticsearch, but I can see the JVM metrics in Kibana:

Please let me know if you required any additional information

Can you do the quoted step to include the index mappings? That may be preventing ingestion.

@stuart.nelson, when I GET: apm*/_mapping, I get response but it is too large to attach here, sending few part of it here:

{
    "apm-7.16.3-span-000001": {
        "mappings": {
            "_meta": {
                "beat": "apm",
                "version": "7.16.3"
            },
            "dynamic_templates": [
                {
                    "labels": {
                        "path_match": "labels.*",
                        "match_mapping_type": "string",
                        "mapping": {
                            "type": "keyword"
                        }
                    }
                },
                {
                    "container.labels": {
                        "path_match": "container.labels.*",
                        "match_mapping_type": "string",
                        "mapping": {
                            "type": "keyword"
                        }
                    }
                },
                {
                    "fields": {
                        "path_match": "fields.*",
                        "match_mapping_type": "string",
                        "mapping": {
                            "type": "keyword"
                        }
                    }
                },
                {
                    "docker.container.labels": {
                        "path_match": "docker.container.labels.*",
                        "match_mapping_type": "string",
                        "mapping": {
                            "type": "keyword"
                        }
                    }
                },
                {
                    "kubernetes.labels.*": {
                        "path_match": "kubernetes.labels.*",
                        "mapping": {
                            "type": "keyword"
                        }
                    }
                },
                {
                    "kubernetes.annotations.*": {
                        "path_match": "kubernetes.annotations.*",
                        "mapping": {
                            "type": "keyword"
                        }
                    }
                },
                {
                    "kubernetes.selectors.*": {
                        "path_match": "kubernetes.selectors.*",
                        "mapping": {
                            "type": "keyword"
                        }
                    }
                },
                {
                    "labels_string": {
                        "path_match": "labels.*",
                        "match_mapping_type": "string",
                        "mapping": {
                            "type": "keyword"
                        }
                    }
                },
                {
                    "labels_boolean": {
                        "path_match": "labels.*",
                        "match_mapping_type": "boolean",
                        "mapping": {
                            "type": "boolean"
                        }
                    }
                },
                {
                    "labels_*": {
                        "path_match": "labels.*",
                        "mapping": {
                            "scaling_factor": 1000000,
                            "type": "scaled_float"
                        }
                    }
                },
                {
                    "histogram": {
                        "mapping": {
                            "type": "histogram"
                        }
                    }
                },
                {
                    "transaction.marks": {
                        "path_match": "transaction.marks.*",
                        "match_mapping_type": "string",
                        "mapping": {
                            "type": "keyword"
                        }
                    }
                },
                {
                    "transaction.marks.*.*": {
                        "path_match": "transaction.marks.*.*",
                        "mapping": {
                            "scaling_factor": 1000000,
                            "type": "scaled_float"
                        }
                    }
                },
                {
                    "strings_as_keyword": {
                        "match_mapping_type": "string",
                        "mapping": {
                            "ignore_above": 1024,
                            "type": "keyword"
                        }
                    }
                }
            ],
            "date_detection": false,
            "properties": {
                "@timestamp": {
                    "type": "date"
                },
                "agent": {
                    "dynamic": "false",
                    "properties": {
                        "build": {
                            "properties": {
                                "original": {
                                    "type": "keyword",
                                    "ignore_above": 1024
                                }
                            }
                        },
                        "ephemeral_id": {
                            "type": "keyword",
                            "ignore_above": 1024
                        },
                        "hostname": {
                            "type": "keyword",
                            "ignore_above": 1024
                        },
                        "id": {
                            "type": "keyword",
                            "ignore_above": 1024
                        },
                        "name": {
                            "type": "keyword",
                            "ignore_above": 1024
                        },
                        "type": {
                            "type": "keyword",
                            "ignore_above": 1024
                        },
                        "version": {
                            "type": "keyword",
                            "ignore_above": 1024
                        }
                    }
                },
                "as": {
                    "properties": {
                        "number": {
                            "type": "long"
                        },
                        "organization": {
                            "properties": {
                                "name": {
                                    "type": "keyword",
                                    "ignore_above": 1024,
                                    "fields": {
                                        "text": {
                                            "type": "match_only_text"
                                        }
                                    }
                                }
                            }
                        }
                    }
                },
                "child": {
                    "dynamic": "false",
                    "properties": {
                        "id": {
                            "type": "keyword",
                            "ignore_above": 1024
                        }
                    }
                },

The mapping doesn't have any private information, can you create a gist with it on github and post a link?

@stuart.nelson, Please find response below:

Hi @stuart.nelson, Did you get chance to see my gist, any workaround for my issue?

The mappings look fine, thanks for adding them.

Can you send a screenshot of the stack monitoring ui for APM server? Note that this needs to be enabled if it hasn't been already.

This should show us if the APM server is receiving any transactions.

Hi @stuart.nelson Thanks, please see attached screenshot

You need to enable stack monitoring for the APM server, allow it to collect some data, and then navigate to the instance's stack monitoring dashboard. The screenshot provided indicates you are only collecting stack monitoring data for kibana and Elasticsearch.

@stuart.nelson Thanks, I tried lot but I am not able to add APM server for stack monitoring. Actually, in APM-server I enabled x-pack security, but in Kibana "create API key" option is not available. Any other way to find out the root cause

Hi @stuart.nelson, Sorry I am new to elastic stack, but I tried lot and now APM server monitoring is shown in the dashboard, please see image below:

Hi @stuart.nelson, it is observed that whenever I ran the application, the APM server metrics are changed, it indicates that APM server is also working as expected, it is processing events, but at APM server side I suspicious about following log where the response code is 202:

{"log.level":"info","@timestamp":"2022-02-03T08:38:26.143+0530","log.logger":"request","log.origin":{"file.name":"middleware/log_middleware.go","file.line":63},"message":"request accepted","service.name":"apm-server","url.original":"/intake/v2/events","http.request.method":"POST","user_agent.original":"apm-agent-java/1.28.4 (my-application)","source.address":"127.0.0.1","http.request.id":"eeb3ccbf-616d-498e-9654-b1f1fdd73aec","event.duration":9993201337,"http.response.status_code":202,"ecs.version":"1.6.0"}

The 202 response is normal. Can you share the graphs from the apm server stack monitoring dashboard? it should show number of events being ingested split by type (transaction, span, metrics, logs)

Hi @stuart.nelson, as per graph only metrics data is collected, spans, logs and errors are shown 0 value
All:

Spans:

Transactions:

Can you enable debug logging on the java agent? That should indicate how many events it's trying to send. It appears it's an issue between the agent and the server.

@stuart.nelson Please attached logs here, I copied only agent specific logs

@stuart.nelson, any exception/problem found in logs?

@stuart.nelson Did you get chance to see the logs? It will helpful if you provide the solution, I stuck at the last step on instrumentation.