Trying to create a filter in Kibana, there is no proposal

Hi
We have a 8.6.2 stack release.
When creating a filter, either with the UI or with the text field, we don't have any proposal.

This is occuring since we reinstall the stack on a other platform.
Maybe we forgot to update a parameter...

In the advanced settings:

image

Any idea would help.
Thanks in advance
Pascal

1 Like

Hi @pchanas

do you have any message/error in the browser console?

No error, no message

In the network part, I have this request:

Answer is : [ ]

Hello @pchanas

I see that this option is shown when there is no data available for that field in the index :

Could you please query and see if there is data in the Sample Web log or if it was deleted?

Thanks!!

Data is avaiblable:

I tried on a large set of indices and fields. Always the same problem

On an other field, in a dashboard, If I add a control, it's fine:

but the filter on the same field is KO:

Have you tried to extend the timerange of the kibana bar?
I see in the request the timerange is taken into account.

Sure
I used the same timerange to test controls vs filter.
I did several tests.

Hi @pchanas

In the network part you shared, it looks that the time filter was for "last 15 minutes". That seemed to generate a query, which will have returned N items, for the agent.keyword field. But N was probably zero for that time range.

If you do same for different index/field, for which you know there are going to be matches, then in the network you should see the query and response?

FWIW I just did same query as you, same sample logs data set, albeit using later version (9.0.1) and with "last 15 minutes" I dont get any suggestions/proposals either. Changed to "last year" and I did. See screenshots below.


Screenshot 2025-07-07 at 17.09.47

I add data in the 15' range, same behaviour choosing last 1 year:

What's in the response ?

[ ]
empy list

So, the sample data is (I think) somehow tied to the timeframe you downloaded it. Look here:

in my case, that data covered a period of approx 90 days earlier in 2025.

Whats your equivalent discover view?

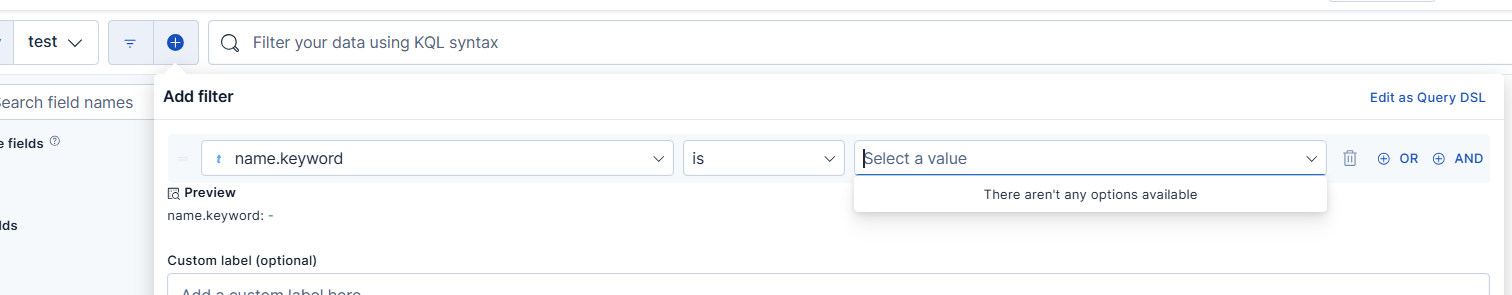
EDIT: Point here is what you call the "proposals" are the results from the POST. If there are no results, an empty list, there will be no proposals presented. Why you might get zero results, it might have been a bug around that release time, or something local to your setup.

For me, the last 1 year query is below, with is POSTed to

http://$ESHOST:5601/internal/kibana/suggestions/values/kibana_sample_data_logs

which is equivalent to

kbn:/internal/kibana/suggestions/values/kibana_sample_data_logs

in Kibana DevTools.

I dont know if Kibana itself might internally cache any of these results or if every call to that endpoint results in a query to elasticsearch itself.

{
  "query": "",
  "field": "agent.keyword",
  "fieldMeta": {
    "count": 0,
    "name": "agent.keyword",
    "type": "string",
    "esTypes": [
      "keyword"
    ],
    "scripted": false,
    "searchable": true,
    "aggregatable": true,
    "readFromDocValues": true,
    "subType": {
      "multi": {
        "parent": "agent"
      }
    },
    "shortDotsEnable": false,
    "isMapped": true
  },
  "filters": [
    {
      "range": {
        "timestamp": {
          "format": "strict_date_optional_time",
          "gte": "2024-07-07T00:00:00.000Z",
          "lte": "2025-07-07T18:55:59.999Z"
        }
      }
    }
  ],
  "method": "terms_enum"
}

Hi

My data are from June 7 to July... and I tested lot of time windows.
I suspect the issue is due to something local to our setup.

Moreover the request is not working in the dev tool... I already tried and got this error:

{
  "error": {
    "root_cause": [
      {
        "type": "parsing_exception",
        "reason": "Unknown key for a VALUE_STRING in [query].",
        "line": 2,
        "col": 12
      }
    ],
    "type": "parsing_exception",
    "reason": "Unknown key for a VALUE_STRING in [query].",
    "line": 2,
    "col": 12
  },
  "status": 400
}

Hi Pascal

I'm out of ideas to troubleshoot.

You can try your specific query from the network tab in your browser, and try that in DevTools, rather than cut and paste mine, but even if that :"works" and doesn't give the 400 error then its likely going to just return 0 results. Your original Q was why no suggestions/proposals, the answer seems to be the result of the query that would build those suggestions is empty, but this just moves the Q to "why that query gives no results?".

Might be something specific to that release, from around that time, and thats been fixed in meantime, but difficult to know unless you or someone finds a specific bug that looks a close fit.

Well, the "we reinstall the stack" and "an other platform" both cover a lot of things. Was it an upgrade, a migration? The old/new "platform" here are different how? And presumably, outside this issue, it's all working OK? Very strange.

Thanks for your help.
I will again check with our infrastructure team about the diff between the old stack (installed on VMs) and the new one (dockerized on GCP)