Hello,
with the help of several guides I tried to show a constant UDP stream of double values (10 8byte double values each second) in a line chart in Grafana but I'm not sure how to get the value from elasticsearch into the Grafana line chart.
The stack I chose for this should be as simple as possible and i took:
UDP Input Plugin for Filebeat -> Elasticsearch -> Grafana
Here is the configuration of the filebeats.yaml file:

The connection to elasticsearch is established and works, filebeat is publishing the correct amount of values every 30 seconds (300 publishes)
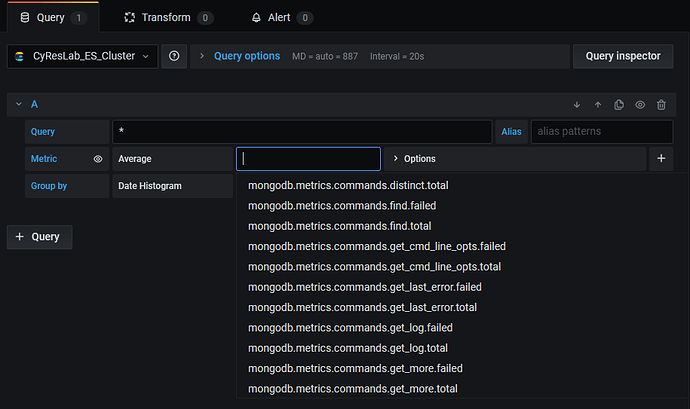
My question is: How do I have to configure my Grafana to connect these values now into a realtime chart? What to choose for the metric? What field should I see there? (I assume the one I put into the filebeat.yaml but i can't find it)

