Unable to fetch data from elasticsearch for alerts from Grafana

I am unable to get the field (hostname, message) from elasticsearch to grafana for setting up my alerts. I wanted to get hostname as well as event message in my alerts so that it will easy for me to identify errors. I have tried multiple ways to do the same For Example : adding variable for the same but it doesnt works. Help me with the stuff. I am sharing image for the alert which I am receiving as alerts fire ups

The above image shows how an alert is fired without the instance name and you can see in messge/descirption/ I have tried multiple ways to get it by providing different ways of naming it

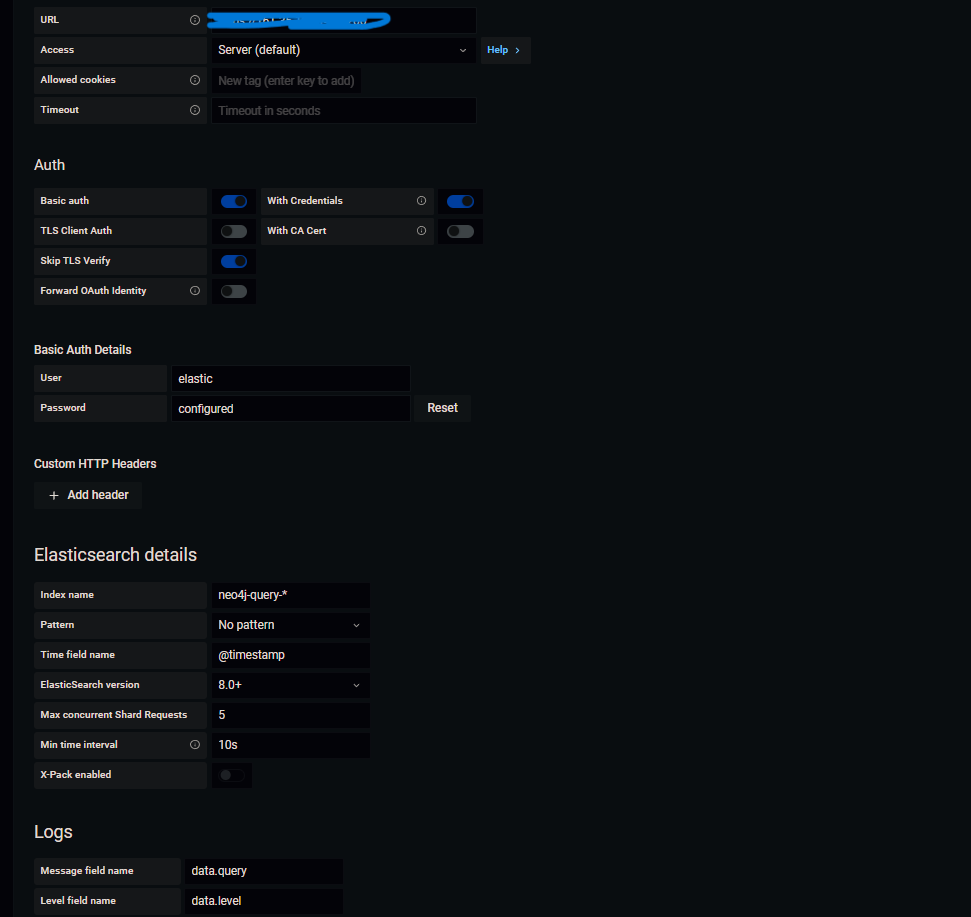
I am also sharing you the data source inputs that I have configured

I am not sure if we have a heap of Grafana knowledge here unfortunately, have you asked on their forums?

Yes I Have already posted the same in their forums but haven't got any reply from their side, I have posted it 4 days ago

Even if we get just hostname it will be very helpfull for us to analyse the error at that particular server

Is there any way, same thing can be done through Elasticsearch, I have gone through the docs of rules and connectors where it is possible to do so. They were asking for upgrade to use it in slack , can't I use slack without the upgrade

This topic was automatically closed 28 days after the last reply. New replies are no longer allowed.