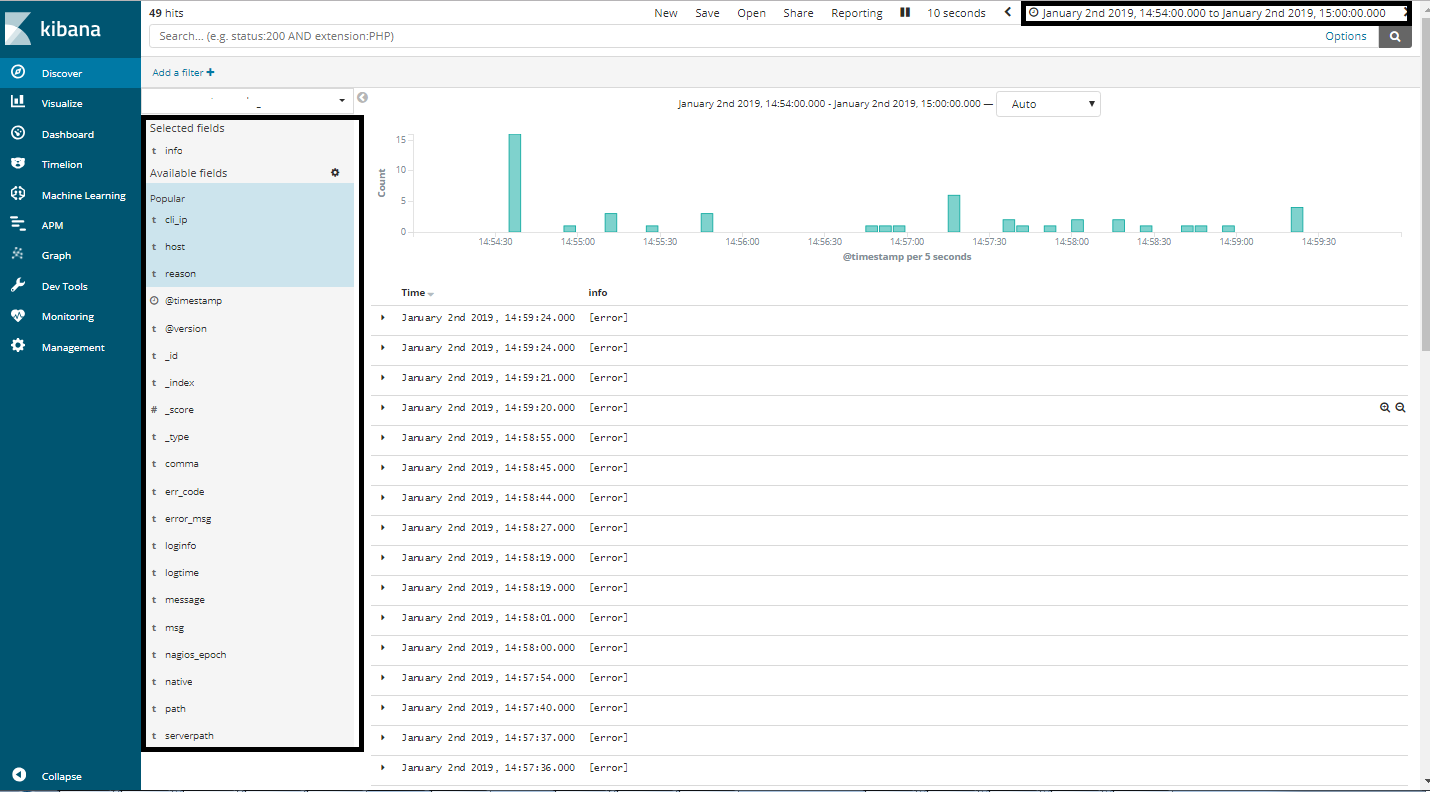
But for the same index from Jan 2 14:54:00 to Jan 2 15:00:00, I am able to see the all fields
err_number
error_msg
nagios_epoch etc...
My queries:
Why i am unable to see the fields "err_number", "error-msg" while selecting whole data?
If not how do i find the same.( i know there is error on Jan 2 14.54:00 ) If i am unaware of the error time how do i find the fields "err_number", "error-msg"
The list of fields should display the accumulation of all fields for all documents which match your query. If one of your queries has a filter on it but the other does not, it's possible that you will retrieve a set of documents with different fields. Can you confirm that the same filters are applied to all of your screenshots?
Thank you for your response.
The search query is same for all the results, only the time difference.
I am able to view all the fields for the particular time period "Jan 2 2019 14:00:00 to Jan 2 2019 16:00:00"
Just i select the time period from "Jan 1 2019 00:00:00" to "Jan 31 2019 23:59:59"
I am unable to view all fields(which comes in the earlier query). Its showing only the major fields.
I think its a unexpected behavior. Could you please help me on this.
Hi there, this definitely looks like a bug to me. I would expect all of the same fields from one query to be available in a broader query. Could you please submit a bug report?
Apache, Apache Lucene, Apache Hadoop, Hadoop, HDFS and the yellow elephant
logo are trademarks of the
Apache Software Foundation
in the United States and/or other countries.