Using query profiler -> need help

Hi there,

You gave me the hint to install x-pack and use the query profiler to analyze slow queries.
I gave it a try and now I am back with more questions; -)

ELK version is 5.1.2.

In visualization I see the following statistics:

Query Duration	2978ms
Request Duration	23691ms
Hits	941807
Index	"tux-*"

Now I extracted the request:

{
  "query": {
    "bool": {
      "must": [
        {
          "query_string": {
            "query": "type: useractionlog  AND NOT tags:processingTimeNull",
            "analyze_wildcard": true
          }
        },
        {
          "match": {
            "stage": {
              "query": "Production",
              "type": "phrase"
            }
          }
        },
        {
          "query_string": {
            "analyze_wildcard": true,
            "query": "*"
          }
        },
        {
          "range": {
            "@timestamp": {
              "gte": 1492466400000,
              "lte": 1492552799999,
              "format": "epoch_millis"
            }
          }
        }
      ],
      "must_not": []
    }
  },
  "size": 0,
  "_source": {
    "excludes": []
  },
  "aggs": {
    "2": {
      "terms": {
        "field": "serviceCall.keyword",
        "size": 20,
        "order": {
          "1": "desc"
        }
      },
      "aggs": {
        "1": {
          "sum": {
            "field": "processingTime"
          }
        }
      }
    }
  }
}

When I put this complete request (including the aggregation part) in the profiler, I get following exception:

[aggregation_execution_exception] Invalid terms aggregation order path [1]. Terms buckets can only be sorted on a sub-aggregator path that is built out of zero or more single-bucket aggregations within the path and a final single-bucket or a metrics aggregation at the path end.

Why? Can I only analyze the query, oder also the aggregation?

If I delete aggregation part, and take only the query and size, I got following results:

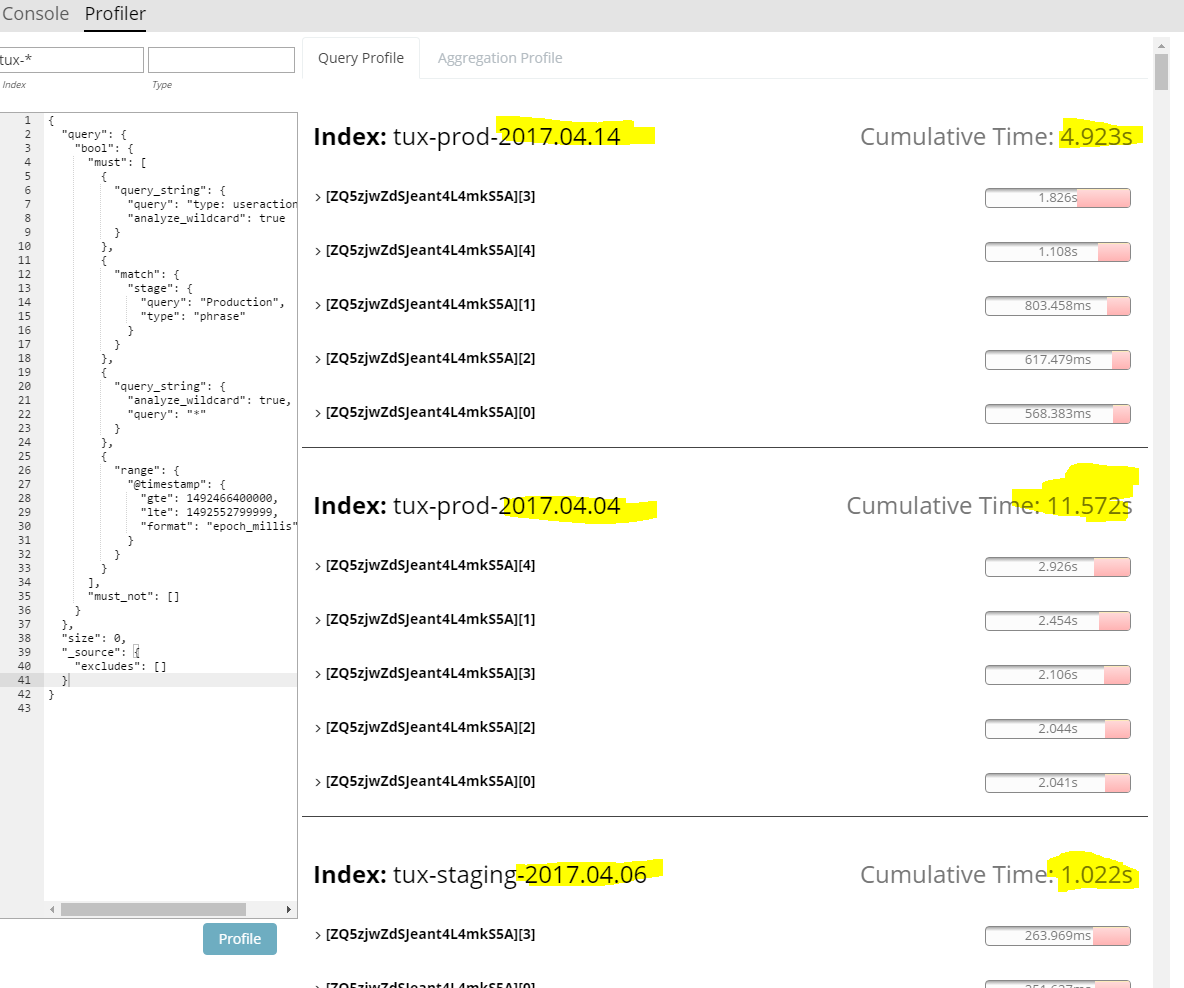
Now I have following questions:

  1. requested timeframe is complete day of 2017-04-18 (CET). So why does querying an index which holds no data for that time interval take so long? As I understand Elasticsearch is smart enough to query only the needed indexes.
    The index pattern is defined as followed:

  2. Why is that query taking so long? Over a second for querying for a tag? Is filtering on tags slower than on fields und must be avoided?

Thanks a lot,
Andreas

I temporary enabled slowlog with threshold 0ms to log all requests coming to elasticsearch on the tux index of today.

PUT /tux-prod-2017.04.18/_settings
{
    "index.search.slowlog.threshold.query.trace" : "0ms"
}

Checking viz-statistics in kibana index "tux-*" is shown.
But slowlog shows, that the current date is correctly used...

[2017-04-18T16:44:54,088][TRACE][index.search.slowlog.query] [node-1] [tux-prod-2017.04.18][4] took[14.5ms], took_millis[14], types[], stats[], search_type[QUERY_THEN_FETCH], total_shards[10], source[{"size":0,"query":{"bool":{"must":[{"query_string":{"query":"type: useractionlog AND NOT tags:processingTimeNull","fields":[],"use_dis_max":true,"tie_breaker":0.0,"default_operator":"or","auto_generate_phrase_queries":false,"max_determined_states":10000,"enable_position_increment":true,"fuzziness":"AUTO","fuzzy_prefix_length":0,"fuzzy_max_expansions":50,"phrase_slop":0,"analyze_wildcard":true,"escape":false,"split_on_whitespace":true,"boost":1.0}},{"match":{"stage":{"query":"Production","type":"phrase","operator":"OR","prefix_length":0,"max_expansions":50,"fuzzy_transpositions":true,"lenient":false,"zero_terms_query":"NONE","boost":1.0}}},{"query_string":{"query":"*","fields":[],"use_dis_max":true,"tie_breaker":0.0,"default_operator":"or","auto_generate_phrase_queries":false,"max_determined_states":10000,"enable_position_increment":true,"fuzziness":"AUTO","fuzzy_prefix_length":0,"fuzzy_max_expansions":50,"phrase_slop":0,"analyze_wildcard":true,"escape":false,"split_on_whitespace":true,"boost":1.0}},{"range":{"@timestamp":{"from":1492519491039,"to":1492526691039,"include_lower":true,"include_upper":true,"format":"epoch_millis","boost":1.0}}}],"disable_coord":false,"adjust_pure_negative":true,"boost":1.0}},"_source":{"includes":[],"excludes":[]},"aggregations":{"2":{"terms":{"field":"serviceCall.keyword","size":20,"shard_size":-1,"min_doc_count":1,"shard_min_doc_count":0,"show_term_doc_count_error":false,"order":[{"1":"desc"},{"_term":"asc"}]},"aggregations":{"1":{"sum":{"field":"processingTime"}}}}},"ext":{}}],

So my enlighting now:

  • viz-statistics only shows the index which is configured in my query.
  • kibana is optimizing the index, NOT elasticsearch (replace * on time based indizes to matching index suffix)
  • the profiler is no doing the same "index magic" like kibana does.
    Is that correct so far?

This topic was automatically closed 28 days after the last reply. New replies are no longer allowed.