1 master server: normal hardware, runs master only node
ES instances:
2 data servers run:
1 master only ES instance with 4GB heap size
1 data only ES instance with 30GB heap size
1 client only ES instance with 16GB heap size (remains off, only turn on for testing)
In total, the ES cluster has 3 master nodes, 2 data nodes and 2 optional client nodes on each server.
When testing dashboard response time, no indexing activity occurs.
As I said, response time when looking at last 1 hour or 24 hours data is ok, but when we look at last 7 days, the dashboad takes longer to refresh than we expect. It's also important to note that we have not fully indexed our IIS logs, 7 millions records for the last 7 days is about 5% of the actual data.
Based on query and request duration, it looks like that the aggregation part is the most time consuming. We gather Perfmon data of the two servers into ES and here are some metrics:
Very low heap size usage on all ES instances
130GB free memory on both servers
No page file usage because I have disabled paging.
Average CPU processor time: 45%
Processor Queue Length: 0 most of the time
Disk second per read/write: < 5ms
We do see about 2-5% CPU spike when the dashboard refreshes. but other metrics look fine.
My questions:
Is there any kind of bottleneck that make the aggreation take that long or is it normal because we are aggregation too many records at the same time on a dashboard?
Is there anyway to improve response time over large amount of records? Looking at monthly data is the minimum timeframe target for now.
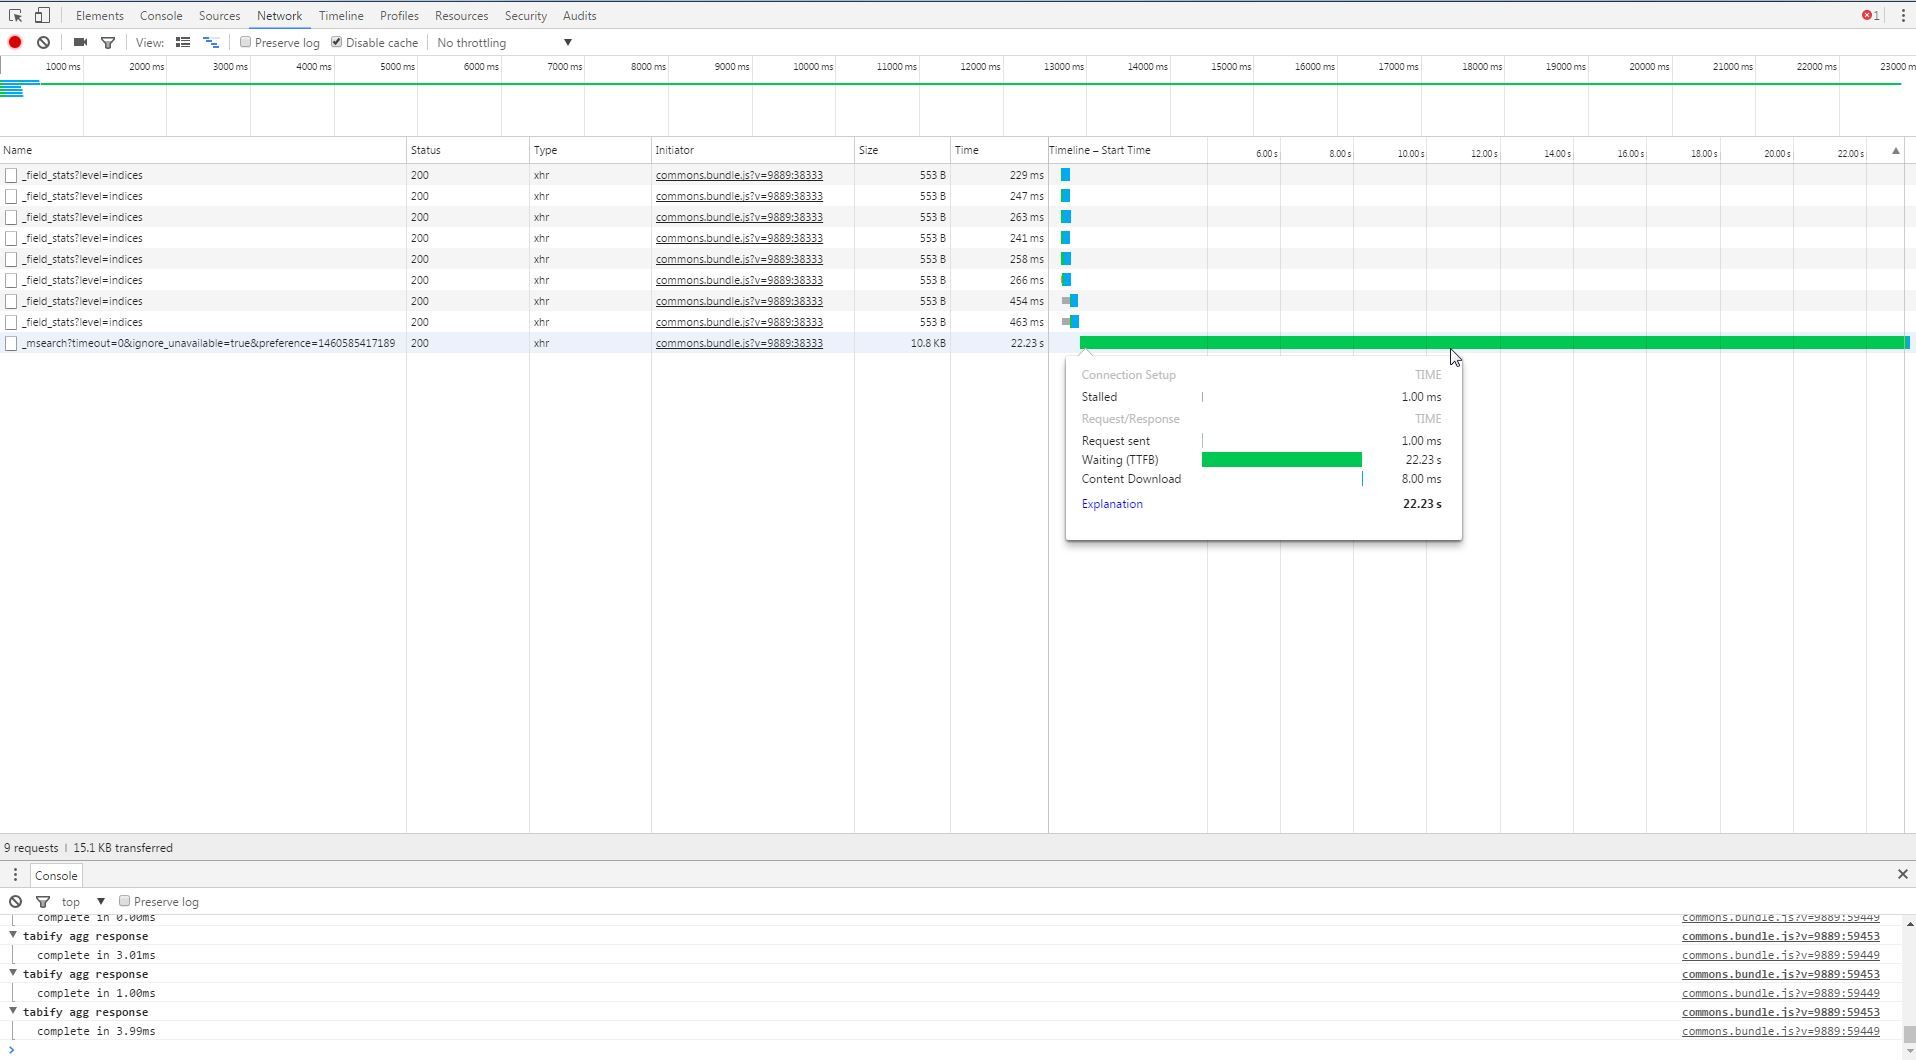
It looks like the query in Elasticsearch is executing relatively quickly, but the request as a whole is very slow. I would start by loading the dashboard page with your browser developer tools open to the network tab and looking at where the most time is being spent (see example below). My guess is that you're pulling a large amount of data over the wire, but there could be other issues that are making the requests slow. The network tab should also tell you how large the response payloads are.
Wow, you're telling me! So either elasticsearch is taking a very long time to respond, or there's a bottleneck on the Kibana backend. Could you try running the same query against Elasticsearch directly while timing it? You should be able to do this with Curl, Postman or even Sense. That should tell us if the problem lies with Kibana or Elasticsearch at least.
Also, what versions of Kibana and Elasticsearch are you using? And is there anything else special about your setup, like a proxy in front of Kibana perhaps?
I'm running ES 2.3 and Kibana 4.5. No proxy in front of Kibana, and Kibana run on the server physicall server with the ES node that it queries agaists. I've tried to point Kibana to Master only node, Data node, and Client node on the server server but response time remains the same in each case.
I'll get the query body and run in Sense to see how long it would take.
I think I found the cause of slowness. I have 10 visualizations on the dashboard, and the longest one, the percentile visualization on time-taken over time, accounts for 90% of the request duration. Wonder why percentiles graphs are so expensive.
Awesome, I'm glad you were able to narrow the problem down! Since the problem seems to lie with this one query, you might want to post a follow up question about it in the Elasticsearch section of the forums. Unfortunately I'm not an expert in analyzing query performance.
Apache, Apache Lucene, Apache Hadoop, Hadoop, HDFS and the yellow elephant
logo are trademarks of the
Apache Software Foundation
in the United States and/or other countries.