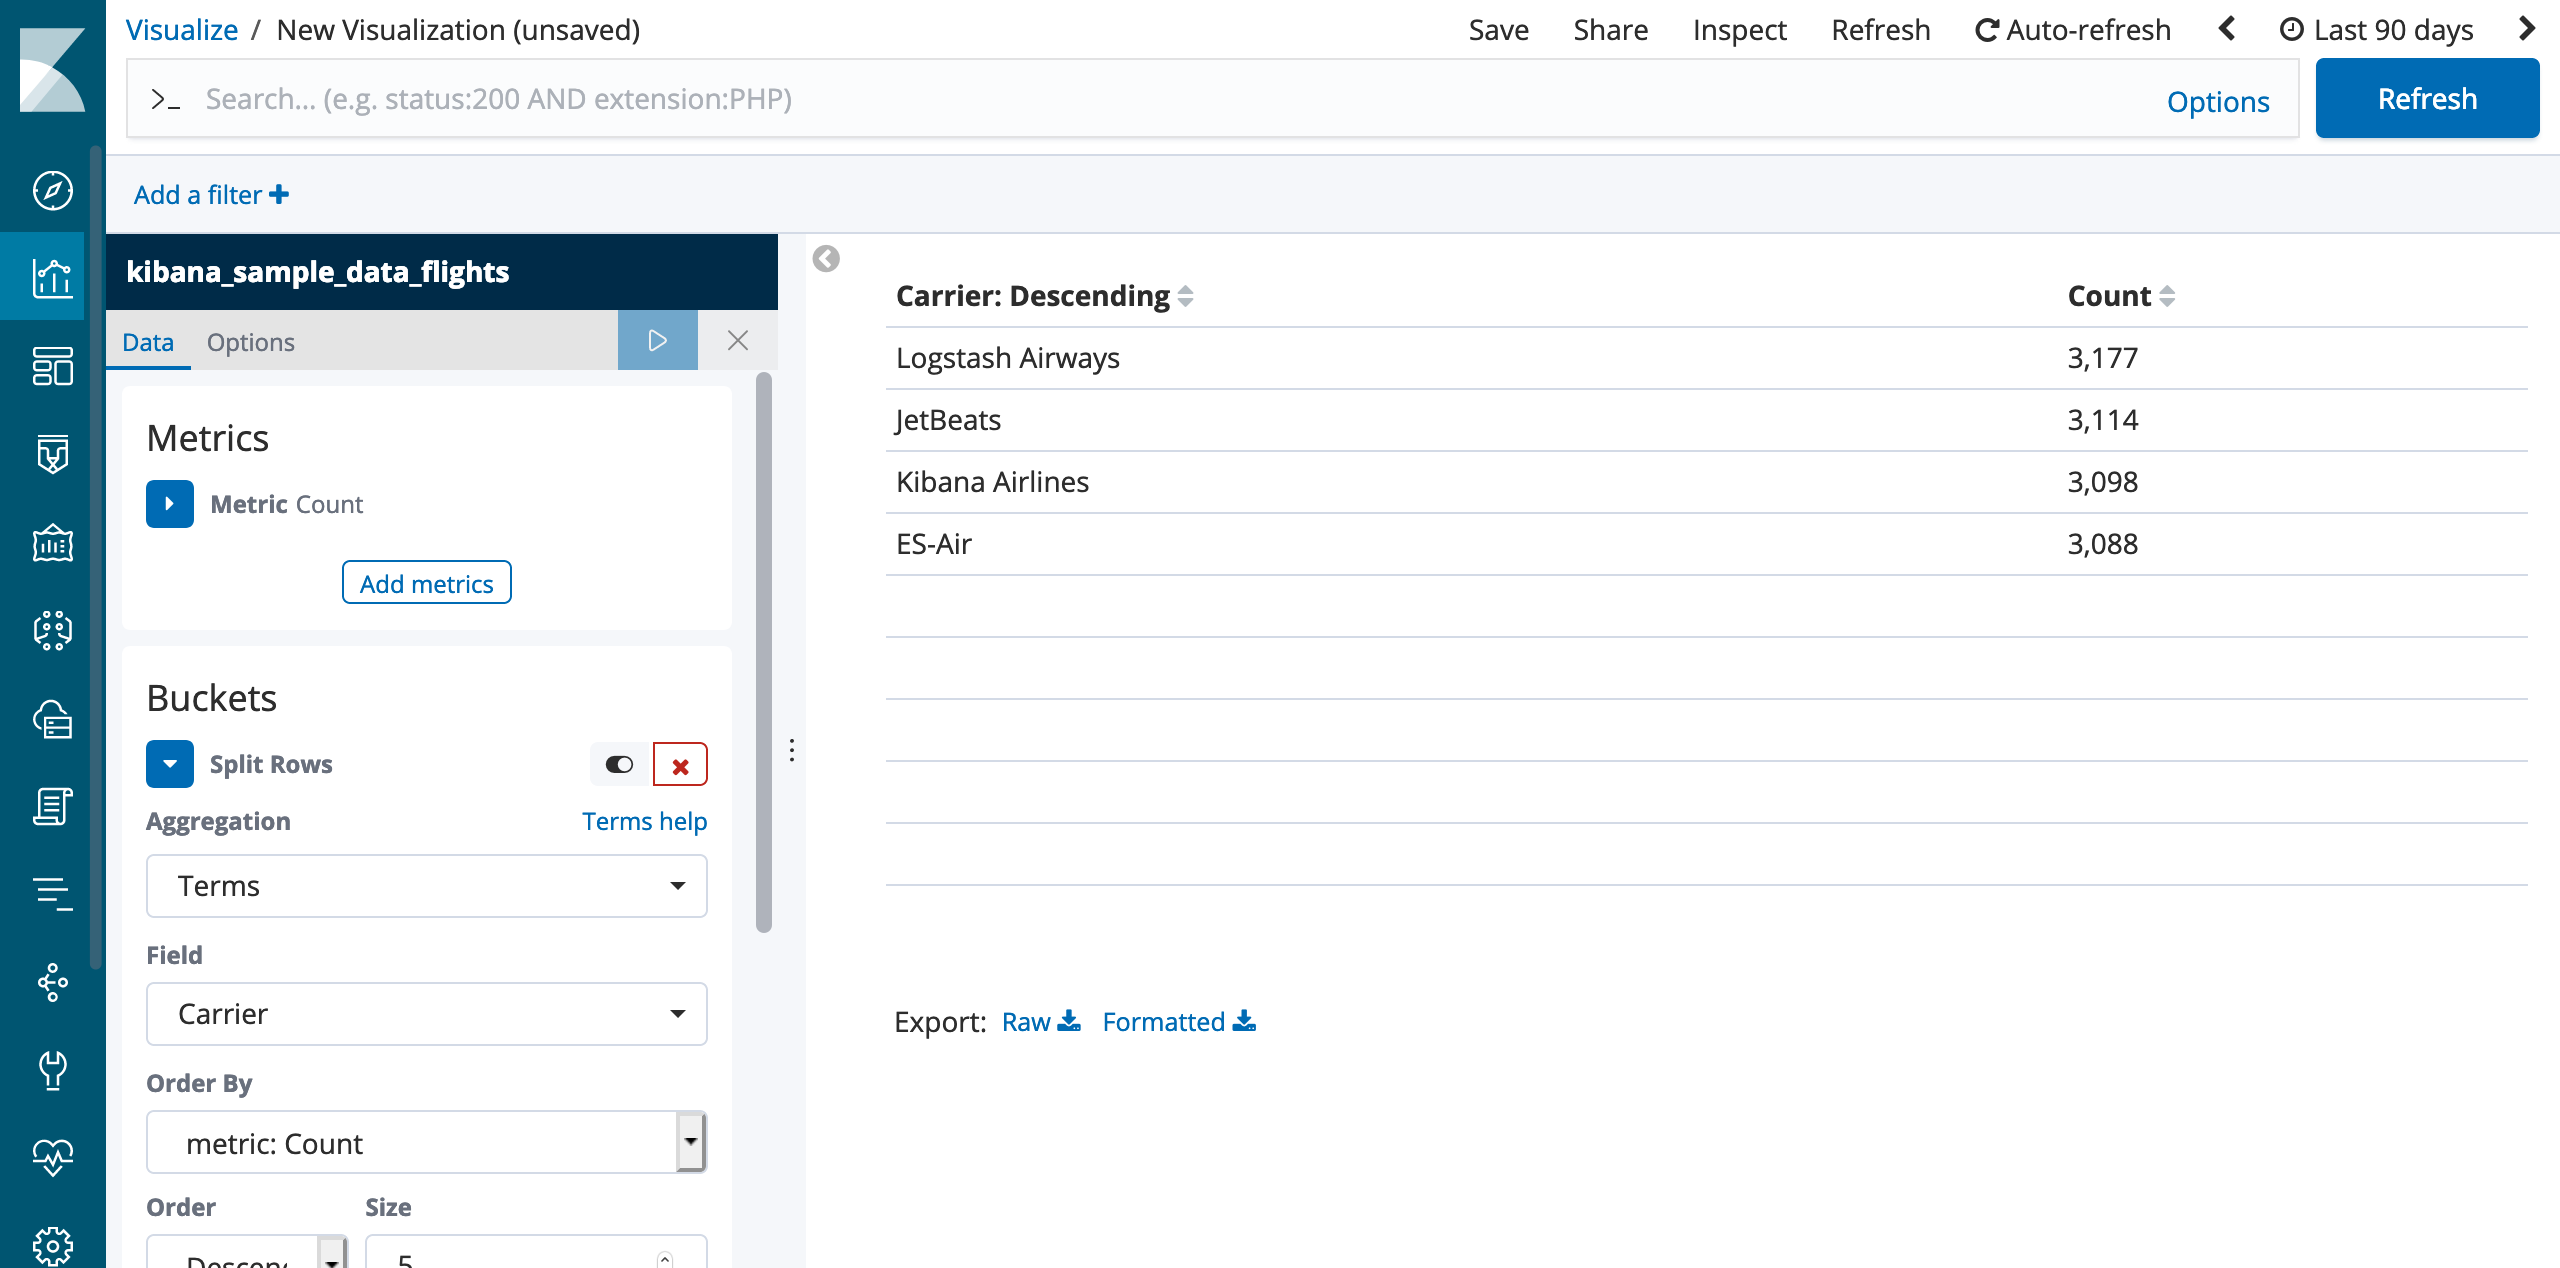
I would like to ask you, how to generate visualize in kibana with this column and value :
Target Address,Total
106.1.6.5,209
114.172.14.110,238
120.12.28.9,89
This source from CSV Files.
I try to create some visualization using Pie Chart. This value didn't show with related keys.
Open the Options tab in the Pie Chart visualization. Make sure the "Show Labels" and "Show Values" checkboxes are checked. This will add series labels and values as percentages.
Alternatively, you can create a Data Table visualization to show the actual counts.
Thanks for your answer.
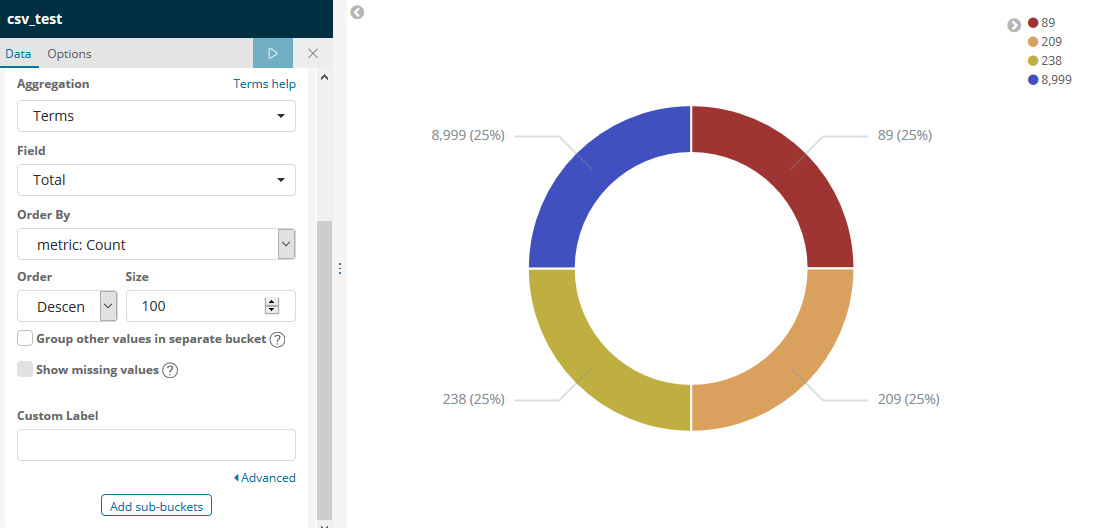
Anyway data incoming from csv. And content is summary of field.
How to visualize with kibana?
This is screenshoot my kibana and index data.
Values of Field Total should be Target Address Value.
But it's cannot generate. Can you show me the tips how to generate visualize data with donut chart?
At this time, pie charts and donut charts only provide percentage values. You may want to use different visualization (column chart, perhaps) if you need other metrics.
Apache, Apache Lucene, Apache Hadoop, Hadoop, HDFS and the yellow elephant
logo are trademarks of the
Apache Software Foundation
in the United States and/or other countries.