how to have bars that show the second but on hover it shows the Success/Error/...?
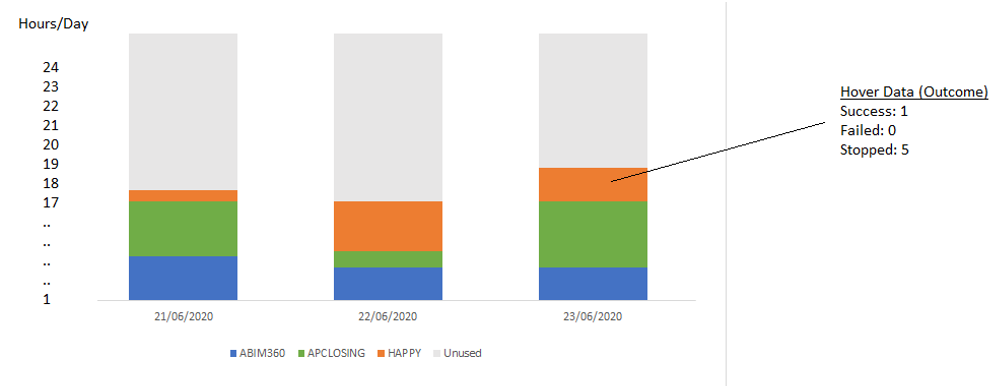
So the main aim is to see how much time our processes took on the server. And as there can only be one process at the same time it cannot be more then 24 hours.
Just to make sure I correctly understand what you are trying to do - the tooltip on hover should show a different breakdown than the bars of the chart, correct (bars should show number of runs by result, hover tooltip should show seconds per process)?
If yes, this is not possible to achieve with a single chart today - it's not possible to show different data in the tooltip, it's always bound to what's visible in the chart. What about two separate charts (one for the result breakdown, one for the seconds per process) next to each other on a dashboard? This seems like an easier way to digest the same information.
Glad it worked out. If someone stumbles over this later - the most likely issue is an integer field value. To return a decimal value for the runtime field, the it has to be casted before the division:
Apache, Apache Lucene, Apache Hadoop, Hadoop, HDFS and the yellow elephant
logo are trademarks of the
Apache Software Foundation
in the United States and/or other countries.