I am trying to display data in kibana which has geo location attribute in it. Thus i am trying to display it using Tile Map.
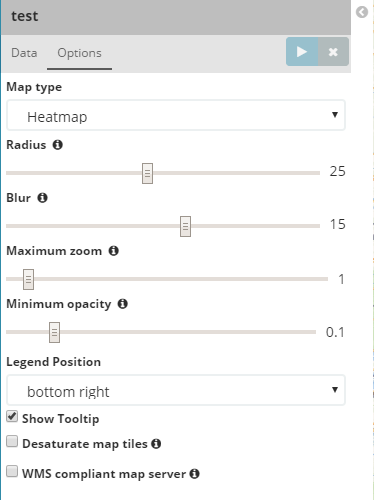
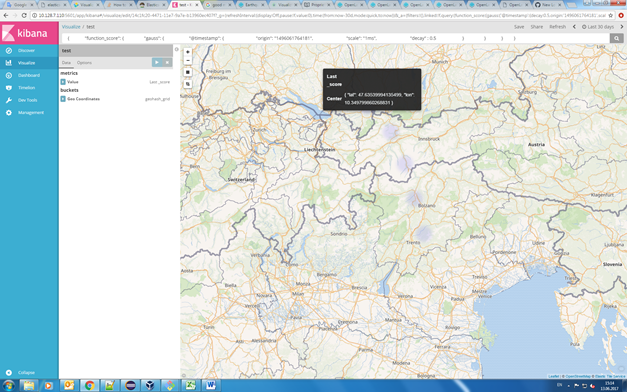
I am able to see the points on the map but what i want is to show in a fading effect. That is the most recent data should have higher value for heat map effect on the map while the oldest entry the least value for heat map color.
Is there a way i can do this?
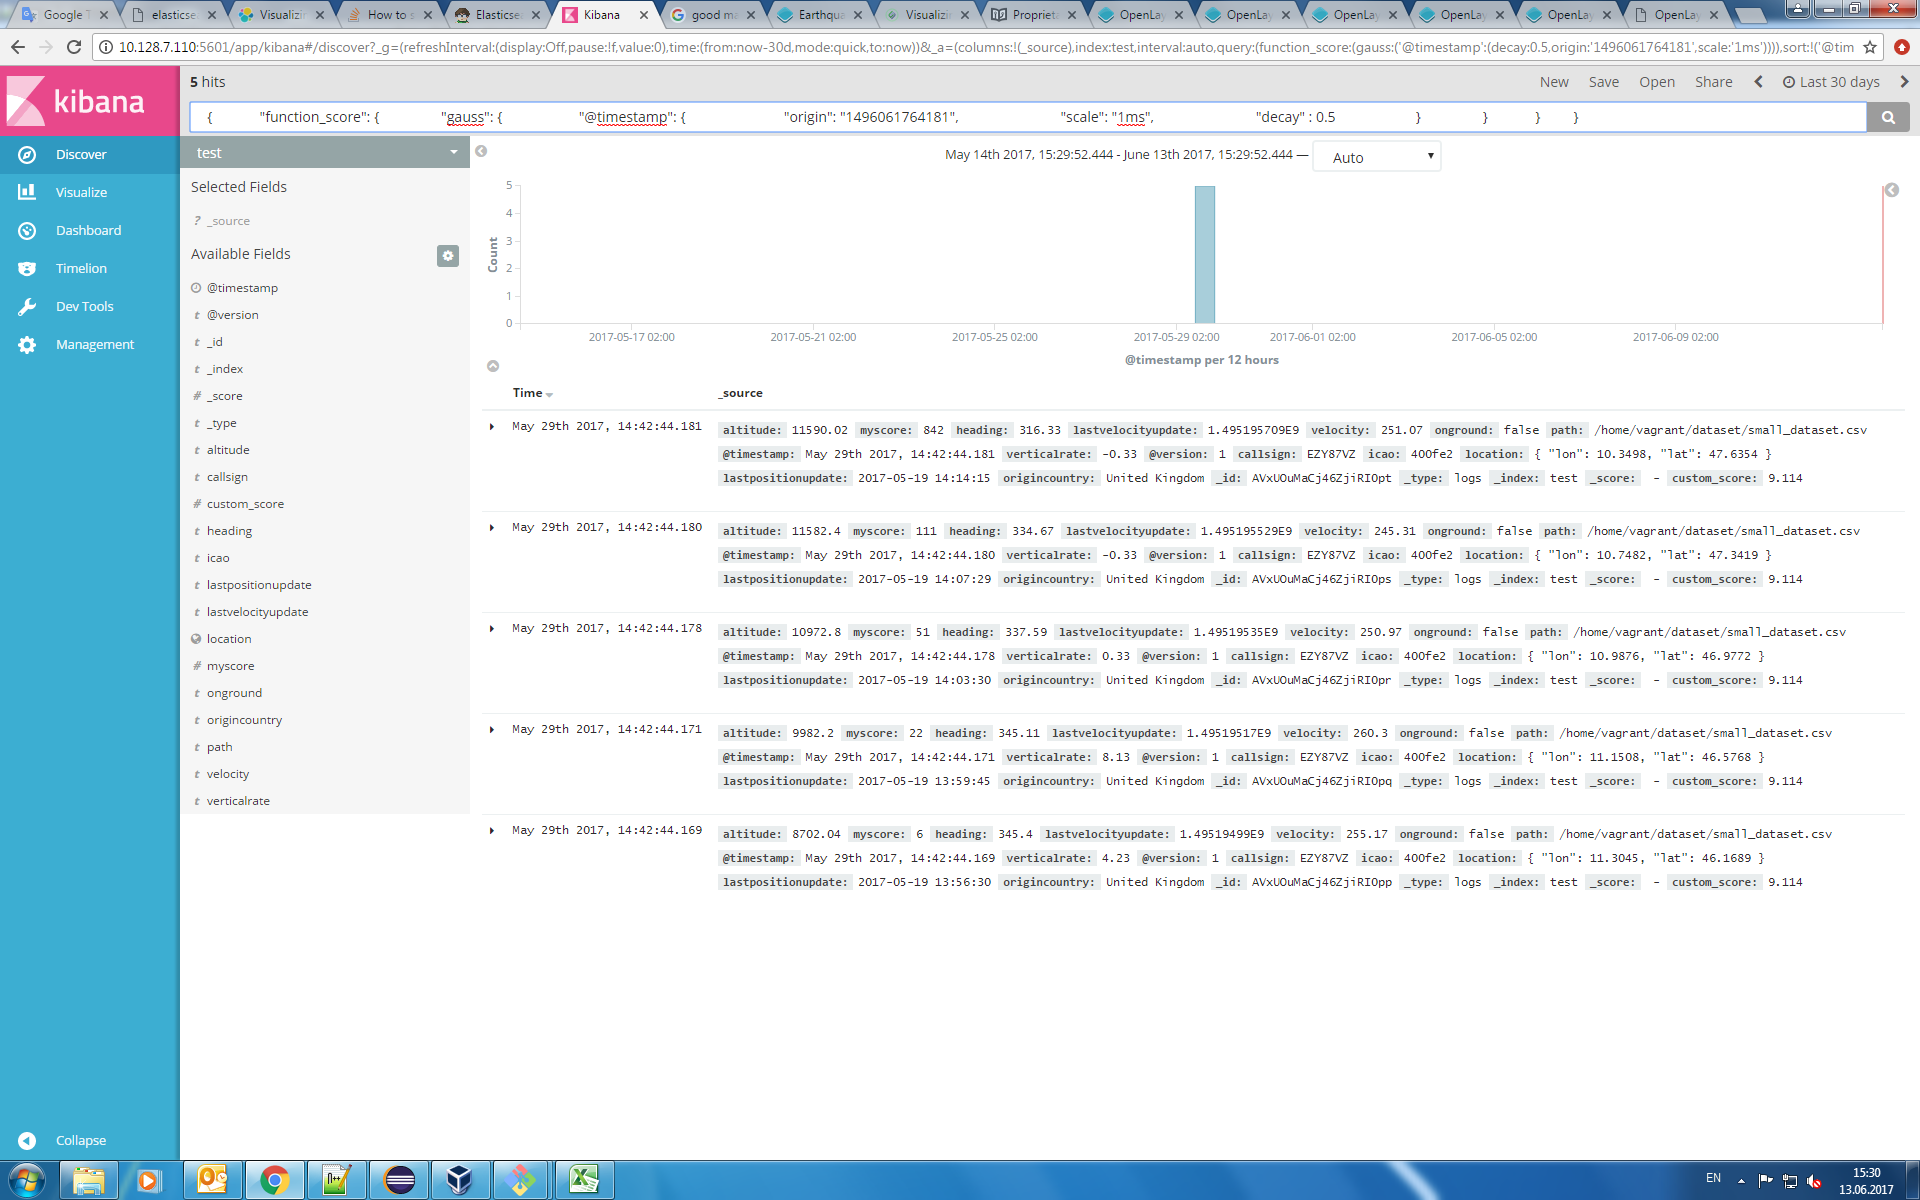
The data that i import using logstash is
8702.04,11.3045,46.1689,255.17,345.4,4.23,400fe2,EZY87VZ,false,1.49519499E9,2017-05-19 13:56:30,United Kingdom
9982.2,11.1508,46.5768,260.3,345.11,8.13,400fe2,EZY87VZ,false,1.49519517E9,2017-05-19 13:59:29,United Kingdom
10972.8,10.9876,46.9772,250.97,337.59,0.33,400fe2,EZY87VZ,false,1.49519535E9,2017-05-19 14:02:30,United Kingdom
11582.4,10.7482,47.3419,245.31,334.67,-0.33,400fe2,EZY87VZ,false,1.495195529E9,2017-05-19 14:05:29,United Kingdom
11590.02,10.3498,47.6354,251.07,316.33,-0.33,400fe2,EZY87VZ,false,1.495195709E9,2017-05-19 14:08:29,United Kingdom
As you can see, this dataset has a date attribute as the second last field, i want to use this date to show somehow the last record with date "2017-05-19 14:08:29" as the darkest spot(red) and other lighter and gradually getting lighter in color and thus the fading effect.
Right now all the points are visible on map but with same intensity of color as shown in below snapshot

The metrics used for creating this is

Can someone suggest how can i achieve this.
Thanks