I am a cybersecurity engineer utilizing Elasticsearch to analyze vulnerabilities detected within my systems. Every week, I import a list of newly detected vulnerabilities into my Elasticsearch index, including essential fields such as the CVE (the vulnerability ID) and the @timestamp (the date of import).
I aim to create a graph in Kibana that visually represents the differences week-over-week regarding new and missing vulnerabilities. Specifically, I would like to track:
New CVEs that appear for the first time in the current week compared to the previous week, along with the exact list of these CVEs.
Missing CVEs that were present in the previous week but are absent in the current week, including their exact identifiers.
I am having trouble visualizing this data effectively. Could anyone provide guidance or examples on how to achieve this in Kibana? Any advice on creating the necessary aggregations or using visualizations to represent this detailed data would be greatly appreciated.
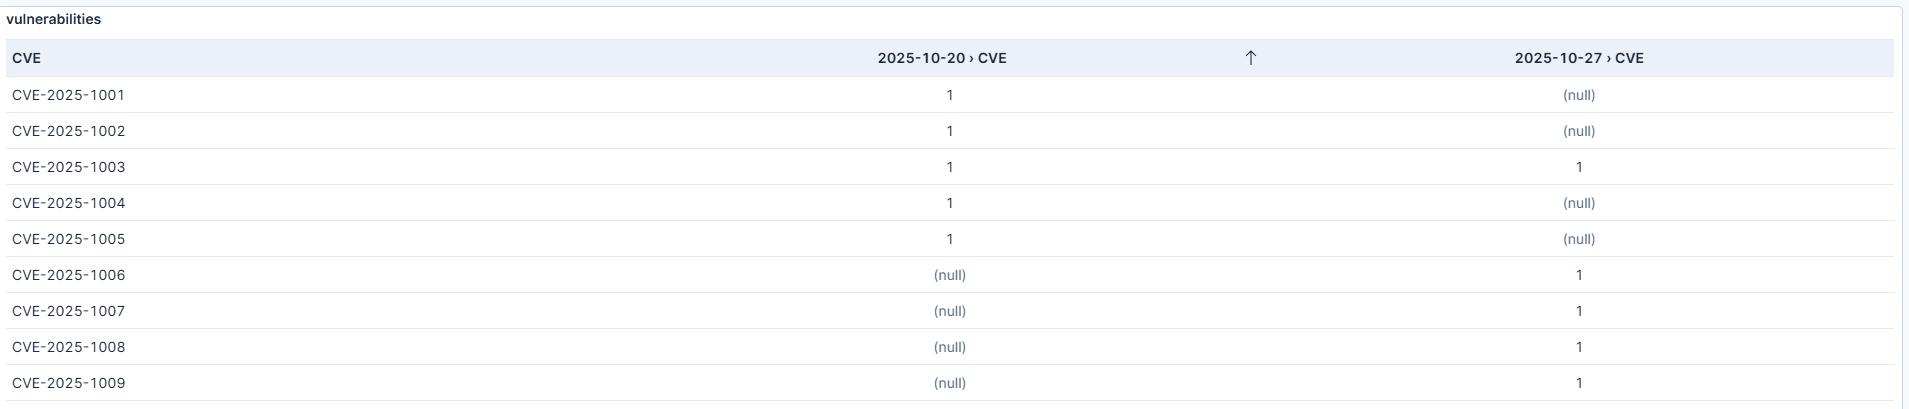
Just a thought to understand if below view can be the start & if you are looking / thinking for a different view which can help to streamline the view :
if we use unique count of records for CVE with @timestamp field with minimum Interval as 1 week ,
last week null , this week 1 means new CVE
last week 1 , this week null means missing CVE
if last week 1 , this week 1 means CVE found last week & this week
This view can clearly be the start of what I'm looking for !
I would like to capture the variation for each entry so I can identify both the new CVEs and those that are missing. My ultimate goal is to represent this data in two bar charts: one for the count of new CVEs and another for the count of missing CVEs for each week.
I wanted to update you on the issue I was facing regarding tracking new and missing CVEs in Kibana. I’ve found a solution that I believe will help anyone in a similar situation.
To monitor the weekly variations of CVEs effectively, we can use the following techniques:
Using the differences() Function:
By applying the formula differences(count()), we can calculate the difference in total records between each week.
Alternatively, count(shift='1w') can be utilized to compare the current week’s data against the previous week’s. Edit : It doesnt work for individual track.
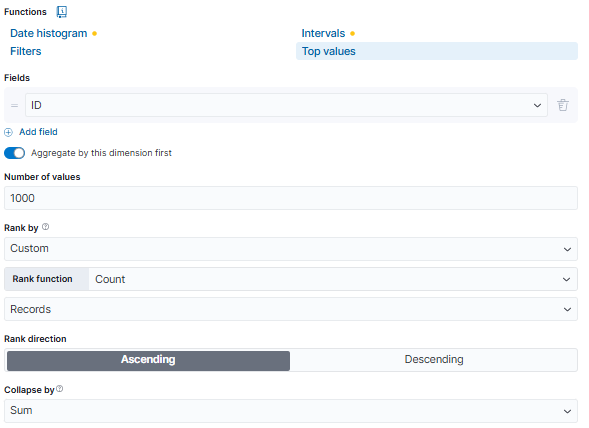
Tracking Individual CVEs:
To track each CVE specifically, utilize a breakdown configuration:
Rank the top CVEs based on the count of records.
Collapse the results to aggregate them efficiently.
Apache, Apache Lucene, Apache Hadoop, Hadoop, HDFS and the yellow elephant
logo are trademarks of the
Apache Software Foundation
in the United States and/or other countries.