Hi Tech Team,
We have some client websites we are commented to provide them the max up-time . For that i need to show them the real-time graphic from my Kibana dashboard. right now i using heartbeat to ping my client site urls.
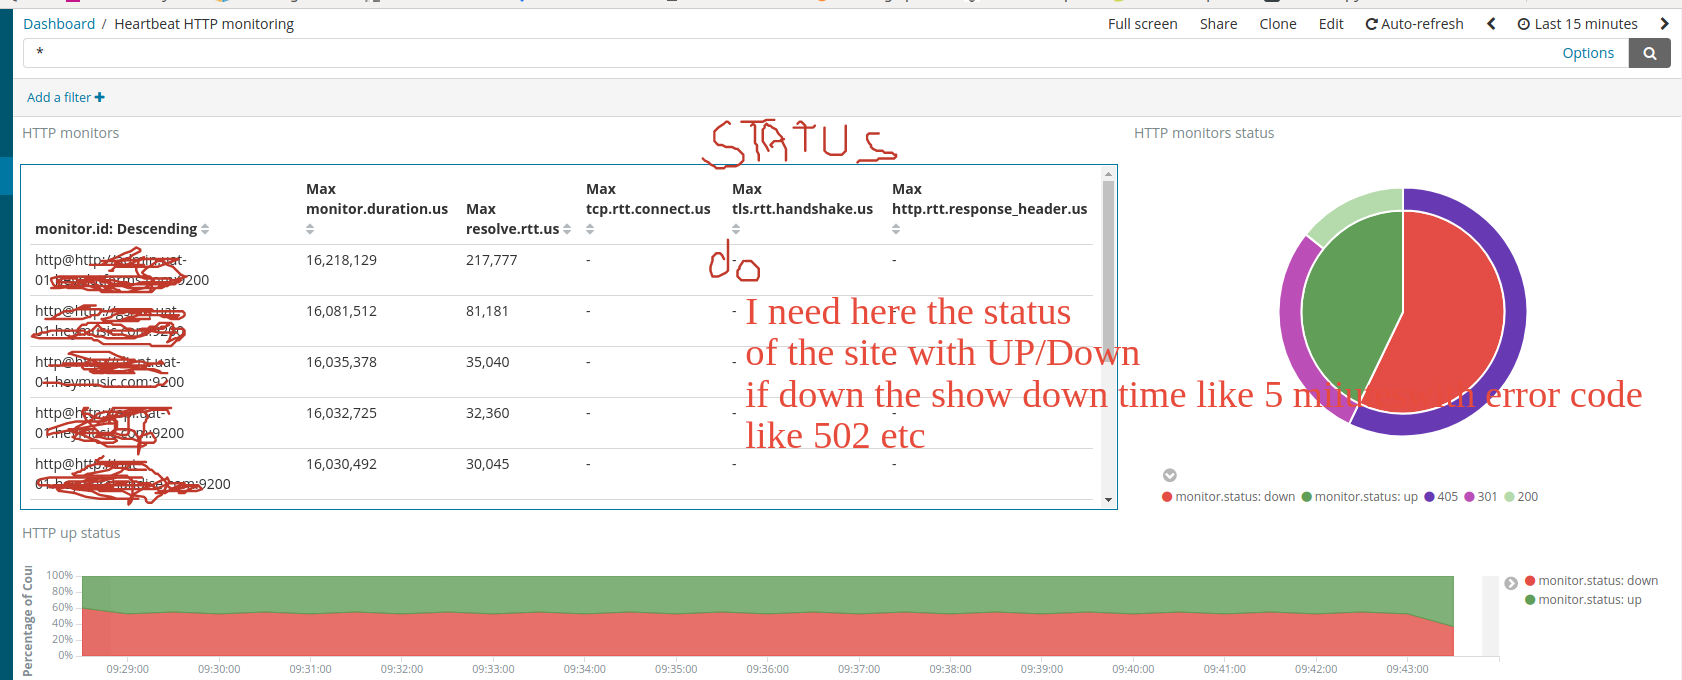
I am not getting the up-time of each time daily, weekly and monthly . i need that updatime and down time for my client . for my team i need to show the realtime website status up/down on the dashboard.
PFA! see my current web site dashboard.

how can i setup as per my requirement.
Thanks.