What is excluded column in kibana index pattern?

I am trying to create an index pattern in kibana and setting the time field to be @timestamp.
The index pattern apparently creates OK with @timestamp as the time filter, but when i refresh the fields, the time filter gets changed to timestamp (I have both timestamp and @timestamp fields in data).

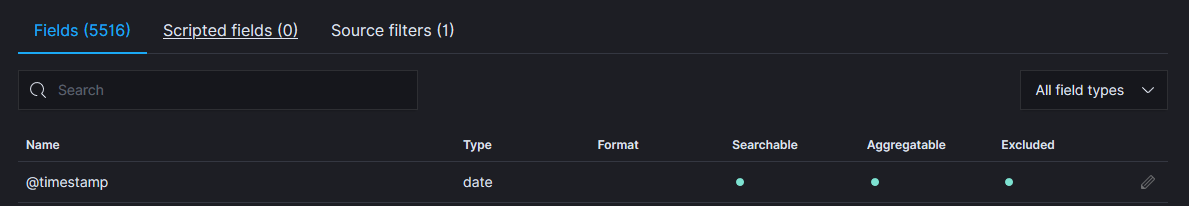
When i look at the fields, I can see that @timestamp has a green dot in the "excluded" column. Why is that, and what does it mean?

Thanks for any help.

Hi

Those are the fields excluded by source filters


So have a look if you've some Source filters configured.

Best,
Matthias

I've noticed this too for a recently created index pattern. If I recreate the index pattern it will work for a short while in the discover tab, but after some time I receive an error, discover becomes unusable for the index pattern, and @timestamp will appear in the index pattern's source filter all by itself. I haven't configured any source filters.

Could you explain in greater detail why this source filter is appearing by itself?
Is it possible to prevent this from happening?
currently v7.9.2 elastic/kibana

It should no appear by itself, could you provide some details / screens of the error that makes Discover unusable after a while? thx!

Thanks for your help Matthias. In my case, the error is reproducible using the following procedure:

  1. I create an index pattern selecting time filter @timestamp from drop down.

  2. The pattern is created (apparently) correctly with no source filters.

  3. I press the refresh field list button (top right corner of sceen)

  4. The time filter has changed from @timestamp to timestamp and a source filter has been applied (it wasn't me...)

Version 7.6.1

I see, is @timestamp an alias of timestamp

Not as far as i know... there is no alias setup in the mapping.

eg. GET myindex/_mapping/field/@timestamp
Doesnt show up any alias set up there.

Is there any thing else i should run to check that?

So, refreshing the index pattern should not exclude fields, just refresh the fieldllist. I wonder if an external source is creating or updating the index pattern? I think I've seen the wazuh-alerts-* index before, how are the log messages ingested in this case? thx

you could also record and share HAR file when refreshing fields, so we could have a closer look, what's happening.

Steps to reproduce:

  1. Create index pattern from filebeat-7.9.2 index (doesn't matter if I designate @timestamp as time-filter or not)
  2. Wait about 5 minutes (index pattern will work during this time and not have source filter present or @timestamp field marked as excluded)
  3. View index pattern in Discover tab, receive following error:
    error1
 FieldParamType/_this.deserialize@https://some.url.com/33984/bundles/plugin/data/data.plugin.js:9:345453
setParams/<@https://some.url.com/33984/bundles/plugin/data/data.plugin.js:9:362647
setParams@https://some.url.com/33984/bundles/plugin/data/data.plugin.js:9:362156
set@https://some.url.com/33984/bundles/plugin/data/data.plugin.js:9:368734
setType@https://some.url.com/33984/bundles/plugin/data/data.plugin.js:9:368146
AggConfig@https://some.url.com/33984/bundles/plugin/data/data.plugin.js:9:361885
AggConfigs/<@https://some.url.com/33984/bundles/plugin/data/data.plugin.js:9:375134
AggConfigs/<@https://some.url.com/33984/bundles/plugin/data/data.plugin.js:9:375555
AggConfigs@https://some.url.com/33984/bundles/plugin/data/data.plugin.js:9:375516
createAggConfigs@https://some.url.com/33984/bundles/plugin/data/data.plugin.js:14:318274
_callee2$@https://some.url.com/33984/bundles/plugin/visualizations/visualizations.plugin.js:9:304414
l@https://some.url.com/33984/bundles/kbn-ui-shared-deps/kbn-ui-shared-deps.js:368:155323
s/o._invoke</<@https://some.url.com/33984/bundles/kbn-ui-shared-deps/kbn-ui-shared-deps.js:368:155077
_/</e[t]@https://some.url.com/33984/bundles/kbn-ui-shared-deps/kbn-ui-shared-deps.js:368:155680
vis_asyncGeneratorStep@https://some.url.com/33984/bundles/plugin/visualizations/visualizations.plugin.js:9:300183
_next@https://some.url.com/33984/bundles/plugin/visualizations/visualizations.plugin.js:9:300519
  1. Check index pattern and find @timestamp field is excluded and source filter has been created.

The issue has appeared around the time of upgrading filebeat elastic and kibana to 7.9.2. I have deleted the .kibana system index and optimize folders and restarted kibana as troubleshooting steps already. I have a separate filebeat instance running version 7.8 that is unaffected by this issue and is running fine. Both filebeat instances have similar configurations and the same ILM policy. I have also tried deleting the index itself and starting the filebeat service again with no luck. The only debug error I see from kibana is:

 {"type":"log","@timestamp":"2020-10-21T16:48:26Z","tags":["debug","plugins","usageCollection","collector-set"],"pid":2065,"message":"not sending [kibana_settings] monitoring document because [undefined] is null or invalid."}

Its also worth mentioning I'm using Wazuh's filebeat index template here. The wazuh-alerts index pattern works fine, here is my filebeat config for reference:

## Wazuh - Filebeat configuration file

filebeat.modules:
  - module: wazuh
    alerts:
      enabled: true
    archives:
      enabled: false
# OwlH Module
  - module: owlh
    events:
      enabled: true

filebeat.config.modules:
  enabled: true
  path: ${path.config}/modules.d/*.yml
## OWLH pipeline sync
filebeat.overwrite_pipelines: true


#setup.template:
#  name: "filebeat"
#  pattern: "filebeat-custom-*
#  settings:
setup.template.settings.index.number_of_shards: 1
setup.template.settings.index.number_of_replicas: 0

setup.ilm.enabled: auto
setup.ilm.pattern: "{now/M{yyyy.MM}}-001"
setup.ilm.overwrite: false
setup.ilm.rollover_alias: "filebeat-%{[agent.version]}-custom"
setup.ilm.policy_name: "filebeat-custom"

Thanks for the excellent summary, seems the index pattern changes for some reason? would it be possible, that you could share an exported index pattern shared object before and after the error occurs? you could export it in the saved object part of our stack management. that would be great!
Many thx!

In my case, the logs are coming from Logstash. Unfortunately the environment is completely locked down and i am not permitted to share a HAR file, but thanks for your offer.

Yes, sharing such data is not possible. There is one thing you could do, export the saved object containing the index pattern before and after the change, diff both exports , share what changed (of course after checking it doesn't contain sensitive data, yes). This would help a lot.

thx @llamskt for sharing you saved objects, so comparing pre (no troubles) and post (troubles) state

It's clear, that the index pattern was updated, the question is, how

diging a bit deeper, it seems that wazuh-kibana-app could be the source of this update

it looks like it's updating the index pattern, adding formatting and sourceFilter:

So the solution to this problem might be the configuration of wazuh?

Thank you for the insight! I'll check and update here if I find a solution there.

edit: deleted

Yes, thankyou Matthias and Matthew (that makes 3 of us!) for your help we are using this Kibana app, i think you have found the issue.

This topic was automatically closed 28 days after the last reply. New replies are no longer allowed.