Steps to reproduce:
- Create index pattern from filebeat-7.9.2 index (doesn't matter if I designate @timestamp as time-filter or not)
- Wait about 5 minutes (index pattern will work during this time and not have source filter present or @timestamp field marked as excluded)
- View index pattern in Discover tab, receive following error:

 FieldParamType/_this.deserialize@https://some.url.com/33984/bundles/plugin/data/data.plugin.js:9:345453
setParams/<@https://some.url.com/33984/bundles/plugin/data/data.plugin.js:9:362647
setParams@https://some.url.com/33984/bundles/plugin/data/data.plugin.js:9:362156
set@https://some.url.com/33984/bundles/plugin/data/data.plugin.js:9:368734
setType@https://some.url.com/33984/bundles/plugin/data/data.plugin.js:9:368146
AggConfig@https://some.url.com/33984/bundles/plugin/data/data.plugin.js:9:361885
AggConfigs/<@https://some.url.com/33984/bundles/plugin/data/data.plugin.js:9:375134
AggConfigs/<@https://some.url.com/33984/bundles/plugin/data/data.plugin.js:9:375555
AggConfigs@https://some.url.com/33984/bundles/plugin/data/data.plugin.js:9:375516
createAggConfigs@https://some.url.com/33984/bundles/plugin/data/data.plugin.js:14:318274
_callee2$@https://some.url.com/33984/bundles/plugin/visualizations/visualizations.plugin.js:9:304414
l@https://some.url.com/33984/bundles/kbn-ui-shared-deps/kbn-ui-shared-deps.js:368:155323
s/o._invoke</<@https://some.url.com/33984/bundles/kbn-ui-shared-deps/kbn-ui-shared-deps.js:368:155077
_/</e[t]@https://some.url.com/33984/bundles/kbn-ui-shared-deps/kbn-ui-shared-deps.js:368:155680
vis_asyncGeneratorStep@https://some.url.com/33984/bundles/plugin/visualizations/visualizations.plugin.js:9:300183
_next@https://some.url.com/33984/bundles/plugin/visualizations/visualizations.plugin.js:9:300519
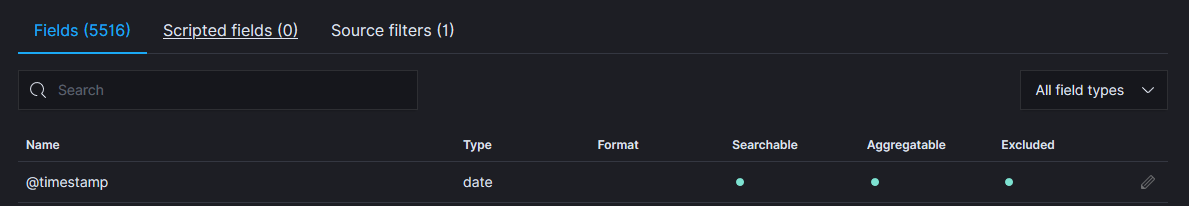
- Check index pattern and find @timestamp field is excluded and source filter has been created.
The issue has appeared around the time of upgrading filebeat elastic and kibana to 7.9.2. I have deleted the .kibana system index and optimize folders and restarted kibana as troubleshooting steps already. I have a separate filebeat instance running version 7.8 that is unaffected by this issue and is running fine. Both filebeat instances have similar configurations and the same ILM policy. I have also tried deleting the index itself and starting the filebeat service again with no luck. The only debug error I see from kibana is:
{"type":"log","@timestamp":"2020-10-21T16:48:26Z","tags":["debug","plugins","usageCollection","collector-set"],"pid":2065,"message":"not sending [kibana_settings] monitoring document because [undefined] is null or invalid."}
Its also worth mentioning I'm using Wazuh's filebeat index template here. The wazuh-alerts index pattern works fine, here is my filebeat config for reference:
## Wazuh - Filebeat configuration file

filebeat.modules:
  - module: wazuh
    alerts:
      enabled: true
    archives:
      enabled: false
# OwlH Module
  - module: owlh
    events:
      enabled: true

filebeat.config.modules:
  enabled: true
  path: ${path.config}/modules.d/*.yml
## OWLH pipeline sync
filebeat.overwrite_pipelines: true


#setup.template:
#  name: "filebeat"
#  pattern: "filebeat-custom-*
#  settings:
setup.template.settings.index.number_of_shards: 1
setup.template.settings.index.number_of_replicas: 0

setup.ilm.enabled: auto
setup.ilm.pattern: "{now/M{yyyy.MM}}-001"
setup.ilm.overwrite: false
setup.ilm.rollover_alias: "filebeat-%{[agent.version]}-custom"
setup.ilm.policy_name: "filebeat-custom"