What Is Lower And Upper Std Deviation?

Hi,

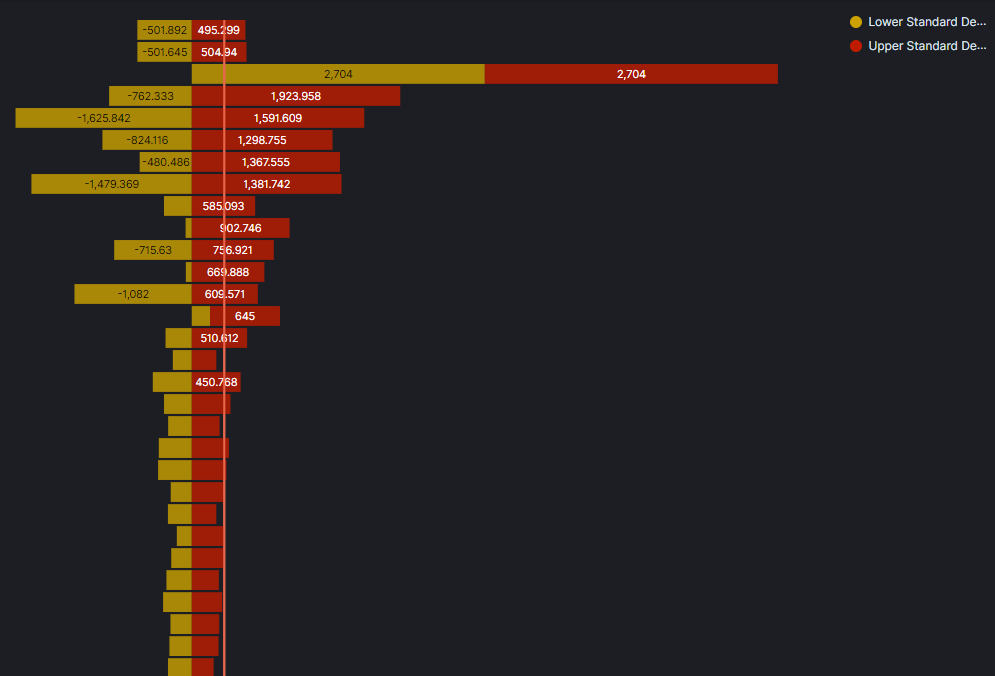
I wanted to show the spread of data about the zero mark wrt to the positive side and negative side.

So i tried with standard deviation - i get 2 indices - lower and upper standard deviation.

What do they mean exactly? Coz after closer look, and thought, i dont think standard deviation was applied correctly here in my use case.

I want to show a visualisation that shows wrt to the zero mark, the max ever value of that bucket to the right and the min ever value of that same bucket to the left.

By default, +/- 2 standard deviations from the average.

See: https://www.elastic.co/guide/en/elasticsearch/reference/current/search-aggregations-metrics-extendedstats-aggregation.html

If you set sigma to 1 ont he query, it'll give you +/- 1 standard deviation.

abit silly qn but how can i edit my query? i searched ard i never found it

Bottom right. Little pencil icon.

Mik

This topic was automatically closed 28 days after the last reply. New replies are no longer allowed.