I am doing some tests in docker-compose.yml, I noticed that when I set the Elasticsearch environment variable to contain XPACK_ML_ENABLED: false, the machine learning page of the Kibana instance will jump to some urls like crazy, and the Kibana page also has the corresponding log to Show errors.
[2022-03-31T12:47:10.150+08:00][INFO ][plugins.security.routes] Logging in with provider "basic" (basic)
[2022-03-31T12:47:10.946+08:00][INFO ][status] Kibana is now available (was degraded)
[2022-03-31T12:55:26.827+08:00][INFO ][plugins.fleet] Beginning fleet setup
[2022-03-31T12:55:26.889+08:00][INFO ][plugins.fleet] Fleet setup completed
[Error [UnsubscriptionError]: 1 errors occurred during unsubscription:
1) ReferenceError: Cannot access 'sub' before initialization] {
    ReferenceError: Cannot access 'sub' before initialization
  errors: [
        at Subscription.<anonymous> (/usr/share/kibana/src/plugins/bfetch/server/streaming/create_compressed_stream.js:52:5)
        at Subscription.unsubscribe (/usr/share/kibana/node_modules/rxjs/internal/Subscription.js:40:30)
        at FinallySubscriber.Subscription.unsubscribe (/usr/share/kibana/node_modules/rxjs/internal/Subscription.js:53:29)
        at Subscriber.unsubscribe (/usr/share/kibana/node_modules/rxjs/internal/Subscriber.js:86:38)
        at FinallySubscriber.Subscriber.unsubscribe (/usr/share/kibana/node_modules/rxjs/internal/Subscriber.js:86:38)
        at Subscriber.Subscription.unsubscribe (/usr/share/kibana/node_modules/rxjs/internal/Subscription.js:53:29)
        at SafeSubscriber._unsubscribe (/usr/share/kibana/node_modules/rxjs/internal/Subscriber.js:241:27)
        at SafeSubscriber.Subscriber.unsubscribe (/usr/share/kibana/node_modules/rxjs/internal/Subscriber.js:86:38)
        at SafeSubscriber.Subscription.unsubscribe (/usr/share/kibana/node_modules/rxjs/internal/Subscription.js:40:30)
[2022-03-31T12:47:07.897+08:00][INFO ][plugins.screenshotting.chromium] Browser executable: /usr/share/kibana/x-pack/plugins/screenshotting/chromium/headless_shell-linux_x64/headless_shell
        at Subscriber.complete (/usr/share/kibana/node_modules/rxjs/internal/Subscriber.js:78:18)
        at SafeSubscriber.complete (/usr/share/kibana/node_modules/rxjs/internal/Subscriber.js:191:26)
        at Subscriber._complete (/usr/share/kibana/node_modules/rxjs/internal/Subscriber.js:96:26)
        at FinallySubscriber.Subscriber._complete (/usr/share/kibana/node_modules/rxjs/internal/Subscriber.js:96:26)
        at FinallySubscriber.Subscriber.complete (/usr/share/kibana/node_modules/rxjs/internal/Subscriber.js:78:18)
        at CatchSubscriber.Subscriber.complete (/usr/share/kibana/node_modules/rxjs/internal/Subscriber.js:78:18)
        at CatchSubscriber.Subscriber._complete (/usr/share/kibana/node_modules/rxjs/internal/Subscriber.js:96:26)
        at MergeMapSubscriber._complete (/usr/share/kibana/node_modules/rxjs/internal/operators/mergeMap.js:88:30)
        at processTicksAndRejections (node:internal/process/task_queues:96:5)
        at Observable.subscribe (/usr/share/kibana/node_modules/rxjs/internal/Observable.js:30:22)
        at Observable._subscribe (/usr/share/kibana/node_modules/rxjs/internal/util/subscribeToArray.js:7:16)
        at MergeMapSubscriber.Subscriber.complete (/usr/share/kibana/node_modules/rxjs/internal/Subscriber.js:78:18)
        at Observable._trySubscribe (/usr/share/kibana/node_modules/rxjs/internal/Observable.js:44:25)
        at Observable.subscribe (/usr/share/kibana/node_modules/rxjs/internal/Observable.js:25:31)
        at MergeMapOperator.call (/usr/share/kibana/node_modules/rxjs/internal/operators/mergeMap.js:37:23)
        at CatchOperator.call (/usr/share/kibana/node_modules/rxjs/internal/operators/catchError.js:30:23)
        at FinallyOperator.call (/usr/share/kibana/node_modules/rxjs/internal/operators/finalize.js:27:23)
        at createStream (/usr/share/kibana/src/plugins/bfetch/server/streaming/create_stream.js:20:74)
        at createCompressedStream (/usr/share/kibana/src/plugins/bfetch/server/streaming/create_compressed_stream.js:53:7)
        at /usr/share/kibana/src/plugins/bfetch/server/plugin.js:58:45
        at /usr/share/kibana/src/core/server/context/container/context.js:62:16
        at runMicrotasks (<anonymous>)
        at Router.handle (/usr/share/kibana/src/core/server/http/router/router.js:163:30)
        at exports.Manager.execute (/usr/share/kibana/node_modules/@hapi/hapi/lib/toolkit.js:60:28)
        at exports.execute (/usr/share/kibana/node_modules/@hapi/hapi/lib/handler.js:31:20)
  ]
}
        at Request._execute (/usr/share/kibana/node_modules/@hapi/hapi/lib/request.js:281:9)
        at Request._lifecycle (/usr/share/kibana/node_modules/@hapi/hapi/lib/request.js:371:32)
        at Object.internals.handler (/usr/share/kibana/node_modules/@hapi/hapi/lib/handler.js:46:20)
        at handler (/usr/share/kibana/src/core/server/http/router/router.js:124:50)
[2022-03-31T12:56:57.264+08:00][INFO ][plugins.fleet] Fleet setup completed
[2022-03-31T12:56:56.810+08:00][INFO ][plugins.fleet] Beginning fleet setup
Also the Elasticsearch instance has a warn, but I'm not sure if it's relevant.
{"@timestamp":"2022-03-31T04:57:50.880Z", "log.level": "WARN", "data_stream.dataset":"deprecation.elasticsearch","data_stream.namespace":"default","data_stream.type":"logs","elasticsearch.elastic_product_origin":"kibana","elasticsearch.event.category":"api","elasticsearch.http.request.x_opaque_id":"465c0681-cbf7-4ca6-9aab-0c334b9fab85;kibana::management:","event.code":"open_system_index_access","message":"this request accesses system indices: [.async-search, .security-7, .tasks, .transform-internal-007], but in a future major version, direct access to system indices will be prevented by default" , "ecs.version": "1.2.0","service.name":"ES_ECS","event.dataset":"deprecation.elasticsearch","process.thread.name":"elasticsearch[node01.elasticsearch.test.com][transport_worker][T#1]","log.logger":"org.elasticsearch.deprecation.cluster.metadata.IndexNameExpressionResolver","trace.id":"35a2fbeff0bf419a2debf9e82cd6aef7","elasticsearch.cluster.uuid":"-cezmxW7TMKuqZFy_YccFA","elasticsearch.node.id":"9traWmKDSZmC228Ks3JC8A","elasticsearch.node.name":"node01.elasticsearch.test.com","elasticsearch.cluster.name":"test-elasticsearch"}
I think if Kibana detects that the setting XPACK_ML_ENABLED of the corresponding ElatsicSearch is false, would it be better not to display this machine learning entry directly? But I'm not sure how to hide it, and now I always get an error when entering this page. At the same time the page flickers.
Below is the docker-compose.yml I use for testing. After startup, I registered Kibana with ElasticSearch through the token generated by bin/elasticsearch-create-enrollment-token -s kibana.
I think if Kibana detects that the setting XPACK_ML_ENABLED of the corresponding ElatsicSearch is false , would it be better not to display this machine learning entry directly?
You are correct. Kibana should detect that ML is disabled in Elasticsearch and not show the app in the sidebar.
After setting XPACK_ML_ENABLED: false for your Elasticsearch container, did you restart the Kibana container as well?
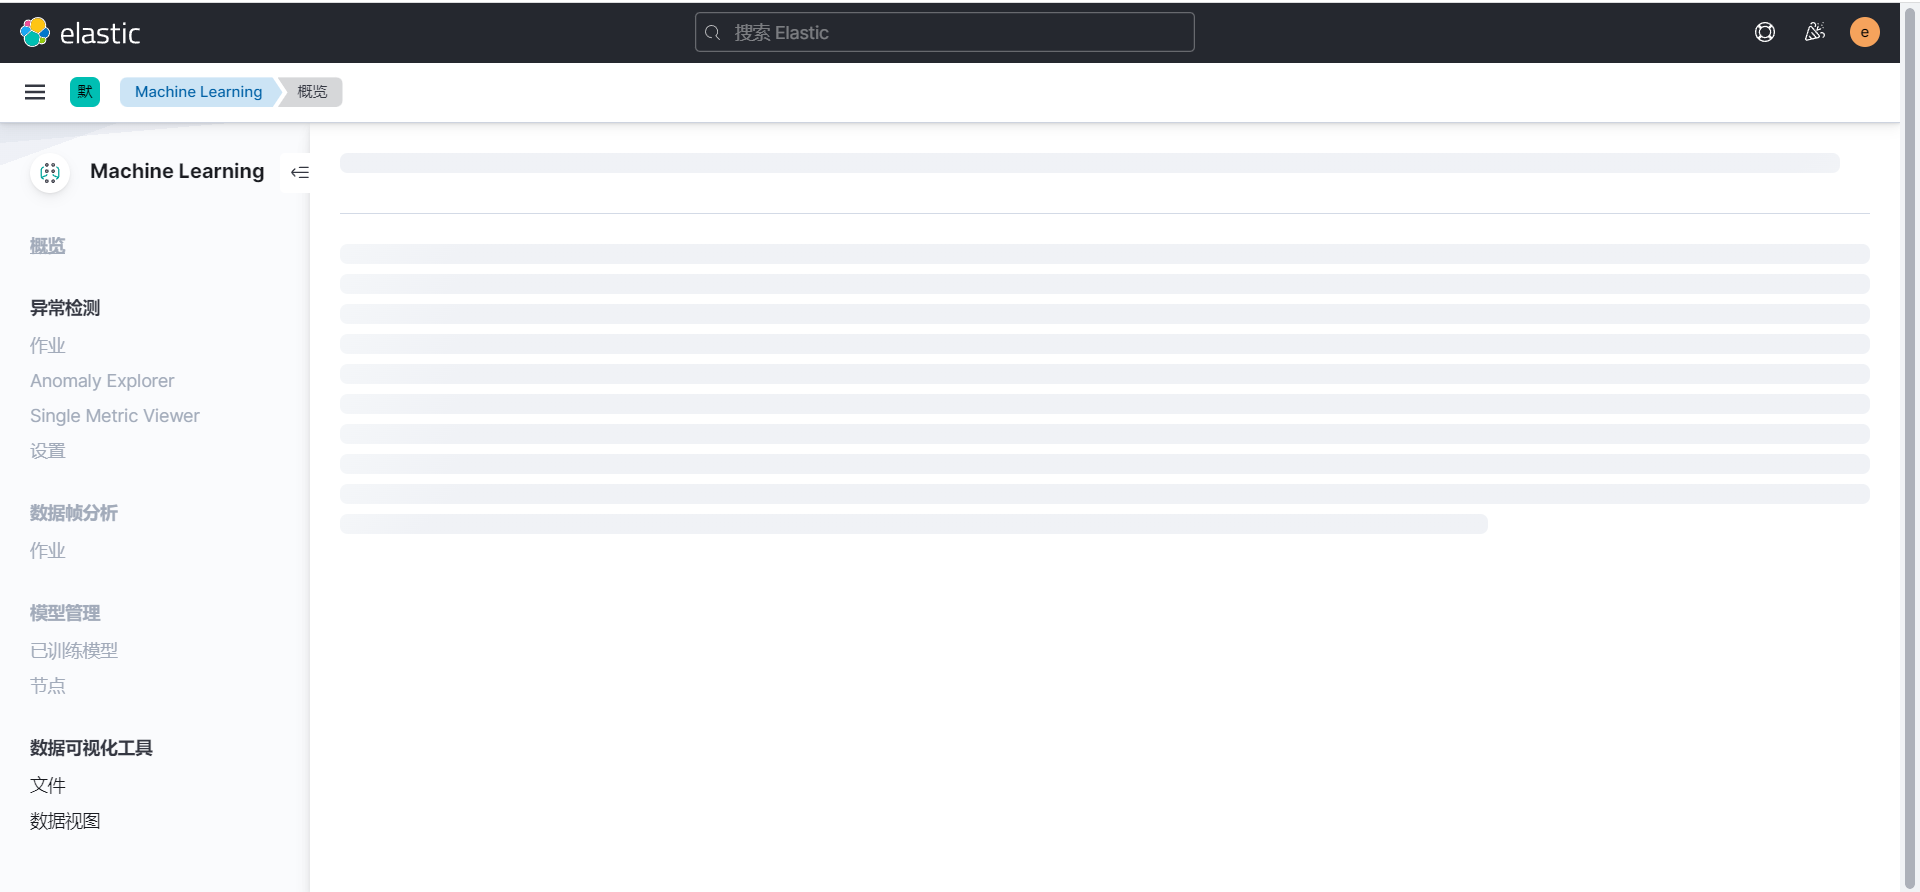
After restarting Kibana, this situation no longer occurs. It seems that the wrong log is caused by the device on my side. But when I enter the machine learning page, I still see that it is switching urls like crazy, causing Chrome's address bar to flicker. Until after a while it goes to localhost:5601/app/ml/datavisualizer. (Yes, no error or warn log in Kibana )
I tried to reproduce the issue with with a docker-compose setup identical to the one mentioned in your first post, but I didn't notice any issues with the URL flickering or any redirect loops when navigating to the Machine Learning page.
Could you please update Chrome to the latest version, clear the cache and let me know if you're still seeing this issue?
Later edit: Is this the flickering you're talking about?
I restarted a new compose instance locally and it didn't reproduce. When I restarted the old instance with docker compose down --volumes and docker compose up -d to restart, the problem disappeared, it seems to be because of the old instance, the /usr/share/kibana/data of kibana of the instance is damaged.
Apache, Apache Lucene, Apache Hadoop, Hadoop, HDFS and the yellow elephant
logo are trademarks of the
Apache Software Foundation
in the United States and/or other countries.