Hello,
I have a index called kong (the main index), and a Rollup job in this index grouping every 24h which has a index calld rollup_job_kong_gateway.
If we take a look directely in the index Kong and run the following query:
GET kong/_search
{
"size": 0,
"query": {
"bool": {
"must": [
{"range": {
"@timestamp": {
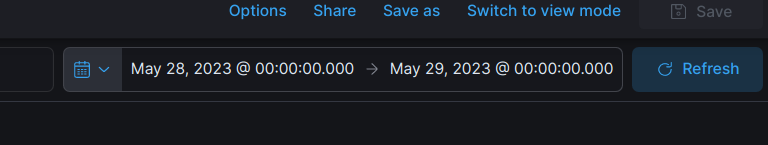
"gte": "2023-05-28T00:00:00.000",
"lte": "2023-05-30T00:00:00.000"
}
}}
]
}
},
"aggs": {
"daily_sum": {
"date_histogram": {
"field": "@timestamp",
"calendar_interval": "1d"
},
"aggs": {
"daily_count": {
"value_count": {
"field": "@timestamp"
}
}}
},
"count_total_requests": {
"value_count": {
"field": "@timestamp"
}
},
"count_total_nome_integrador": {
"cardinality": {
"field": "nomeIntegrador.keyword"
}
}
}
}
This is the result:
Day 2023-05-28 total of 1,428,413 requests
Day 2023-05-29 total of 1,735,944 requests.

And now if we execute the same query (just summing instead of counting) on the rollup index we have the same values:
GET rollup_job_kong_gateway/_search
{
   "size": 0,
  "query": {

   "bool": {

     "must": [

    {"range": {
      "@timestamp.date_histogram.timestamp": {
        "gte": "2023-05-28T00:00:00.000",
        "lte": "2023-05-29T00:00:00.000"
      }
    }}


     ]
   }


  },
  "aggs": {

    "daily_sum": {
      "date_histogram": {
        "field": "@timestamp.date_histogram.timestamp",
        "calendar_interval": "1d"
      },


      "aggs": {
        "daily_count": {
          "sum": {
            "field": "@timestamp.date_histogram._count"
          }
        }}


    },


    "count_total_requests": {
          "sum": {
            "field": "@timestamp.date_histogram._count"
          }
    },
    "count_total_nome_integrador": {
          "cardinality": {
            "field": "nomeIntegrador.keyword.terms.value"
          }
        }


  }
}

What I can't understand is: Why Kibana dashboard is showing different values?
This is a dashboard on Kong (main index): (Only day 28)
Why does it now only shows 1,436,142 instead of 1,428,413 that is in its index?

If we take a look, it's just showing the total of records:

And this is the Rollup Job Dashboard: (Only day 28)
It shows the right value

If we take a look, it's just showing the total of records (by summing the count of timestamp):

I'm litte bit confused, if someone could help me I'd feel happy.