I have duration data that comes in as seconds. I modified the duration field to convert it to hours as follows.

This works well and I am able to see the data in hours in the Discover tab. When I try to visualize this data in a line graph, the Y-axis is appropriately scaled in hours as shown here.
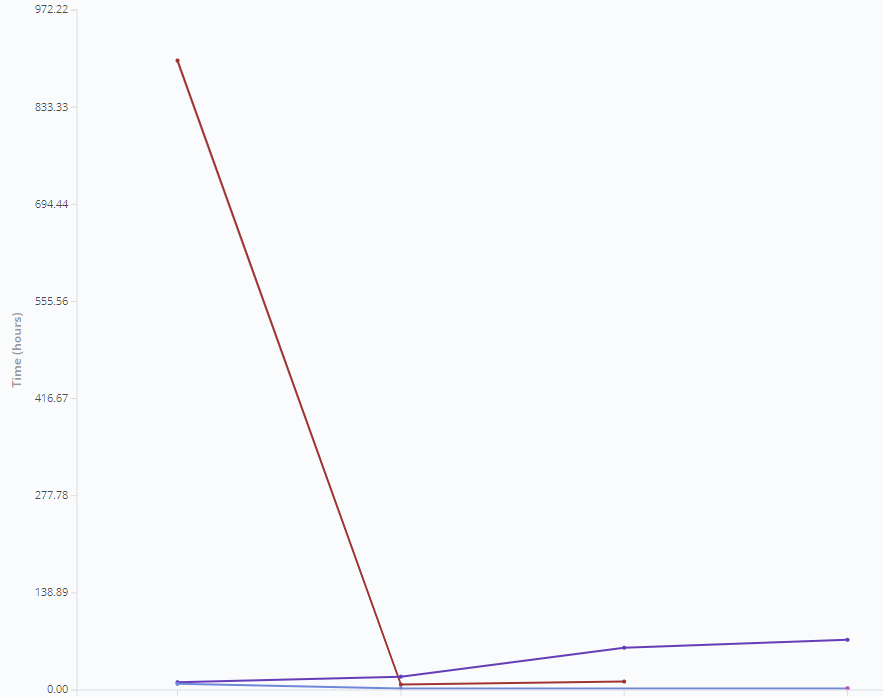
But when I try to visualize this same data along with other data on the Y-axis as follows, the Y-axis is in seconds.

Why does it display duration in hours when it is the only data on the Y-axis but display the same data in seconds when mixed with other data? How can I have it display in hours instead?