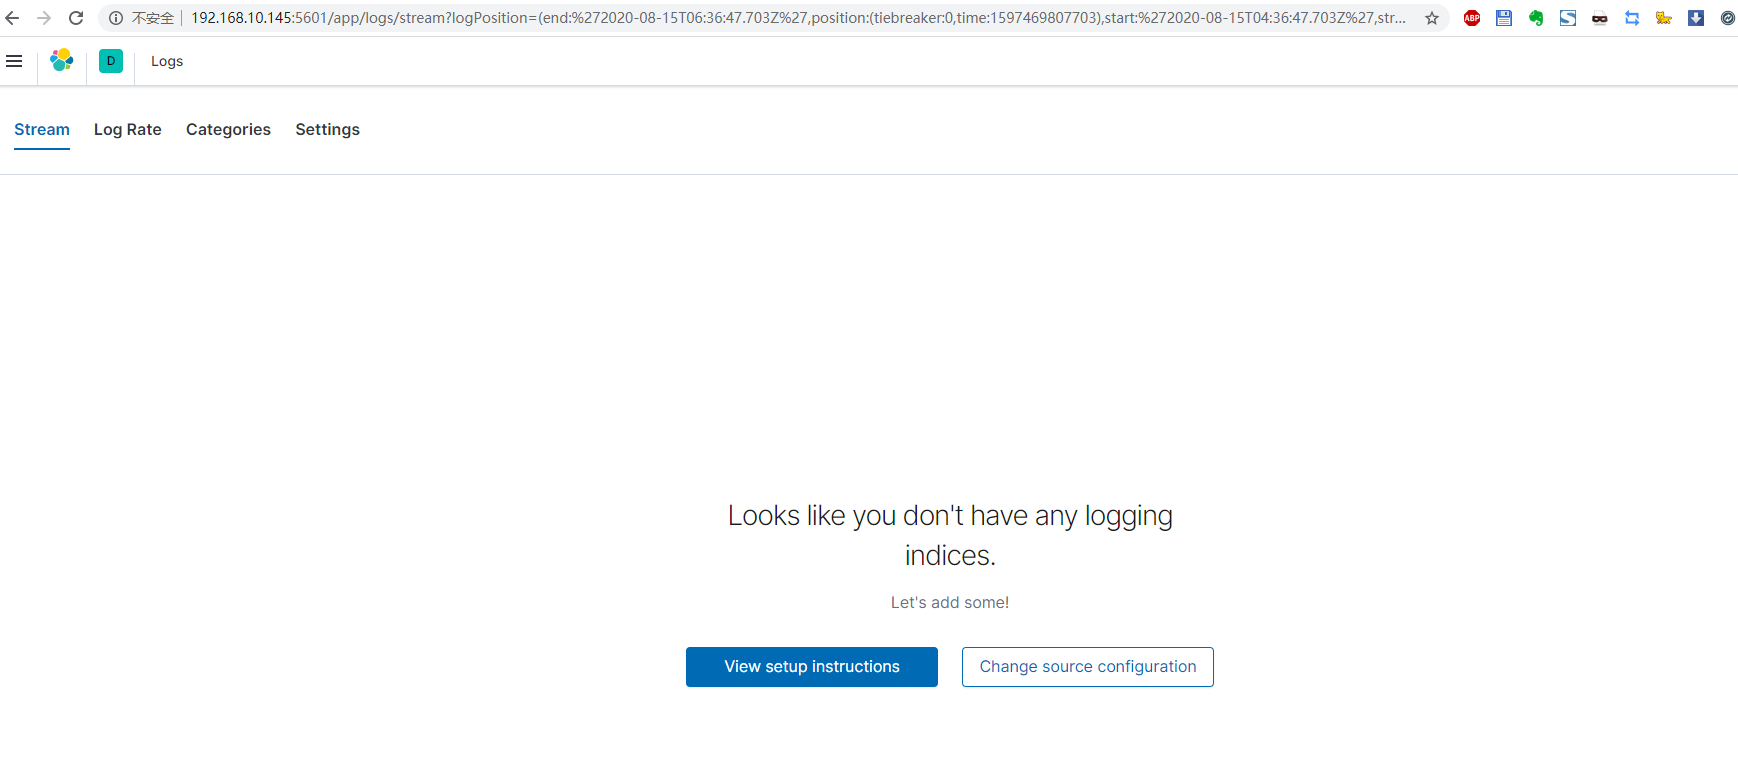
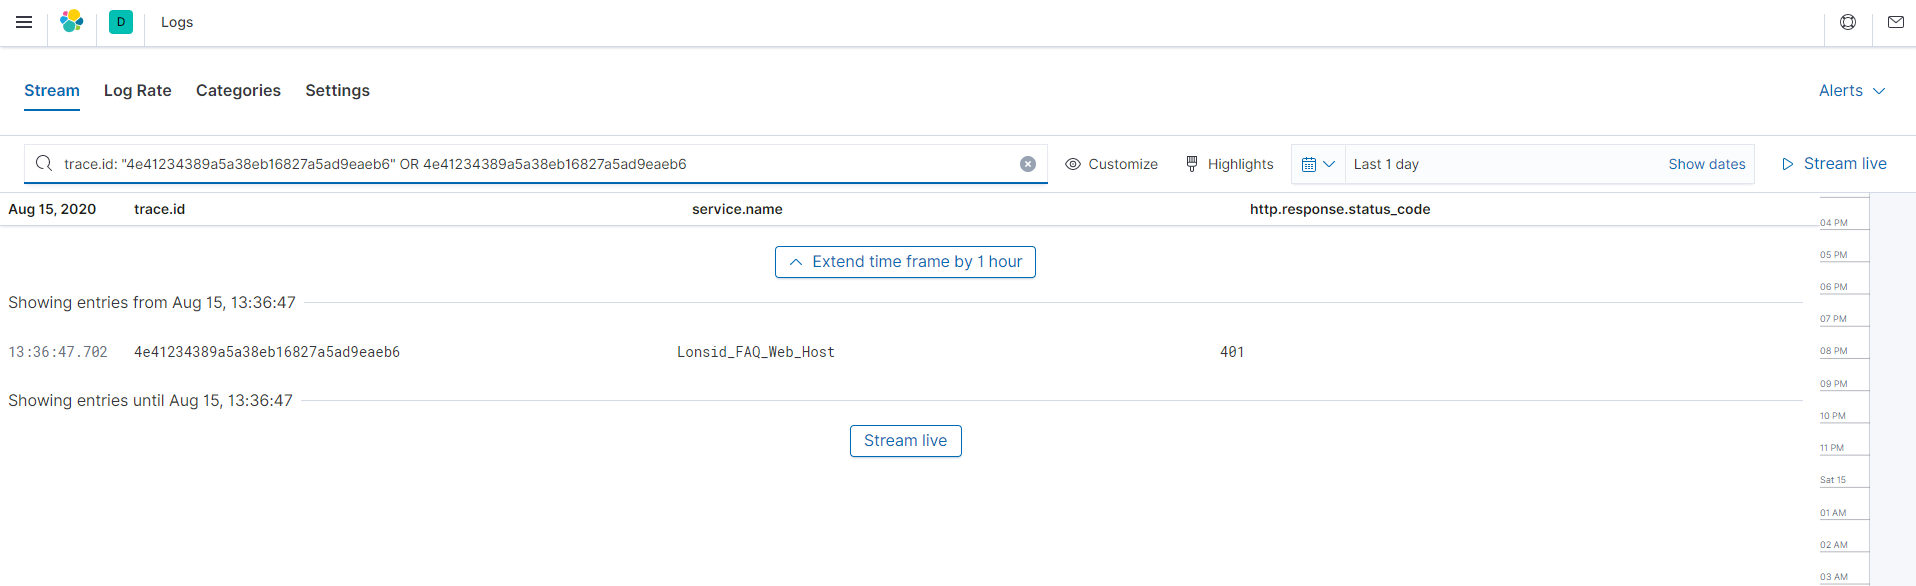
this is a bug that is being tracked in https://github.com/elastic/kibana/issues/74916. The background is that the link is misinterpreted such that (as you noticed) the normal settings (called default) are not loaded. Instead a separate set of settings (called logs) is used. Until the bugfix is shipped in a release you could work around this by updating the second set of settings after navigating via the link from APM to the Logs UI to match the default settings.
Thank you for reporting it and sorry for the inconvenience.
Apache, Apache Lucene, Apache Hadoop, Hadoop, HDFS and the yellow elephant
logo are trademarks of the
Apache Software Foundation
in the United States and/or other countries.