I want to use high count function for a field , for this i select Advanced Confiugration wizard Machine Learning > Anomaly Detection > Create Job > Advanced configuration
Here i am using high_count detector for test field , i want to find anomaly in this field and i have another field called verb.keyword which contain service name , so basically verb.keyword (service name) based anomaly detection on high_count of test value (decline count)
While selecting detector it shown me two options by_field and over_field
How can i know what i have to choose in by_field or in over_field is there any option where i can choose high_count becuase i cant see in multi-metric.
then pick a split field. From the description of your data I suggest using verb.keyword as the split field.
The count functions work with event rates, i.e. the number of occurrences of the event in a time period. high count split by verb.keyword will find anomalies where there is an unusually high number of events for any of the values of verb.keyword.
What is in the test field? Is it a numerical value? If test is a number then consider the high_sum function on the test field split by verb.keyword
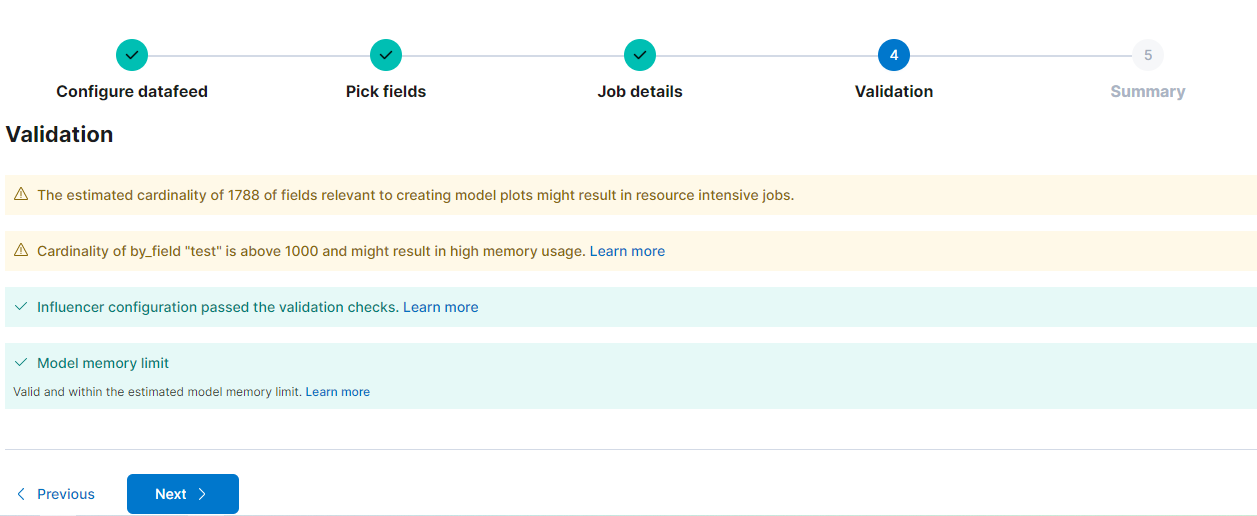
In this job i applied high_count by test over "verb.keyword" and also choose verb.keyword as an inluencer
What this above graph shoowing, i know upper bound and lower bound but what does these(upper and lower bound) means in above graph
And one thing i learned that in single metric viewer we get slider to view anomaly and in Anomaly Explorer we can see as a table . So am i right about Single Metric Viewer and Anomaly Explorer
Is there any difference between high_count and High Count(Event rate)
No they are both the same function but the text description is slightly different
I recommend reviewing the documentation for the different anomaly detector functions. Count functions are described as "Count functions detect anomalies when the number of events in a bucket is anomalous.". If test is a numerical field and you are looking for anomalies in the value of test then try the metric function.
In the chart above you see a plot of the number of documents over time that contain the verb.keyword field with the value REPL_BACKLOG_REPORT. The count goes from 1 to 3, per bucket interval there is nothing particularly interesting here. I am guessing that analysing the value of test with a metric function will be more interesting.
Apache, Apache Lucene, Apache Hadoop, Hadoop, HDFS and the yellow elephant
logo are trademarks of the
Apache Software Foundation
in the United States and/or other countries.