Hi Avivc,
You still haven't posted example data such that I can understand your question, so I'm making some up. In the Dev Console I did this;
POST my_index/defect/
{
      "Project._refObjectName": "value1"
}

POST my_index/defect/
{
      "Project._refObjectName": "value2"
}

POST my_index/defect/
{
      "Project._refObjectName": "value3"
}

POST my_index/defect/
{
      "Project._refObjectName": "value4"
}

POST my_index/defect/
{
      "Project._refObjectName": "value5"
}

POST my_index/defect/
{
      "Project._refObjectName": "value1"
}

POST my_index/defect/
{
      "Project._refObjectName": "value2"
}
Then I made this scripted field named oneOrTwo;
if (doc['Project._refObjectName.keyword'].value == 'value1' || doc['Project._refObjectName.keyword'].value == 'value2') {
return "value1or2";
} else {
return doc['Project._refObjectName.keyword'].value
}
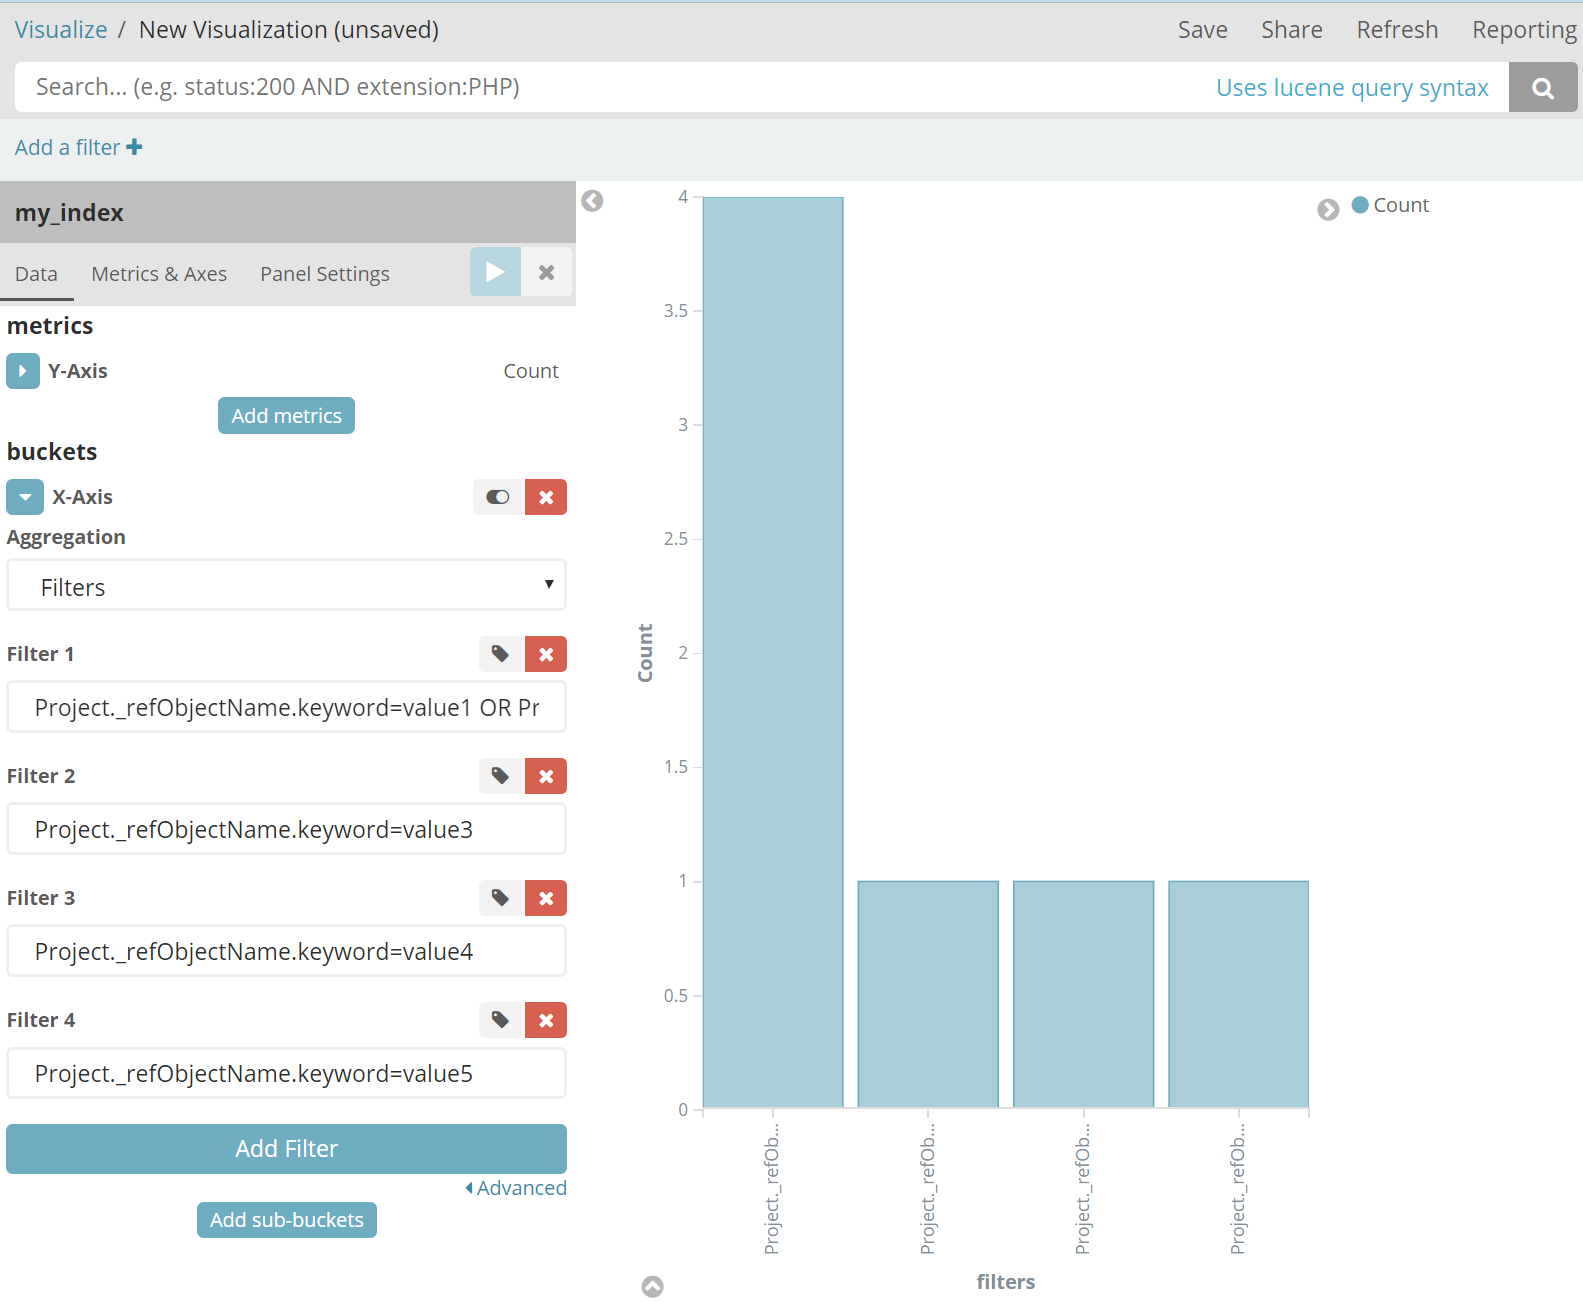
And then I made this visualization which shows a terms aggregation on that scripted field. Since there are 2 docs with value1 and 2 docs with value2 the chart shows a count of 4 docs with the value of value1or2;

I can also create the same chart without using the scripted field by using a Filter aggregation (the first filter is Project._refObjectName.keyword=value1 OR Project._refObjectName.keyword=value2