APM Agent logs shown on Discover but not on APM UI

Hello all, Currently i am using ELK APM for my java application running on tomcat, with centos 7 as a linux distrubution and its my fresh installation but while apm java agent transfer the logs to apm server -> elastricsearch , i can see all the apm-* on discover menu with its logs/mertrics but i cant see any services on the APM UI, as it shows service not available.

Kibana version: 7.13.3
Elasticsearch version: 7.13.3
APM Server version: 7.13.3
APM Agent Java and version: 1.27.0

A common cause for this issue is a missing index mapping. Can you verify the mapping for the service.name field with:

GET apm-*/_mapping/field/service.name

If this returns a text mapping:

    "mappings" : {
      "service.name" : {
        "full_name" : "service.name",
        "mapping" : {
          "name" : {
            "type" : "text",
            "fields" : {
              "keyword" : {
                "type" : "keyword",
                "ignore_above" : 256
              }
            }
          }
        }
      }
    }

then that is your issue and you'll need to recreate them - deleting the existing ones and restarting APM Server with the default configuration will accomplish that.

Hi @gil, thanks for the quick response , yeah i got this:

when i run this get request to my service name , i got this issue

Could you please tell me how to delete the existing ones and recreate , as i am new to elk-Apm, Looking forward to hear form you.

Ok great, then you've confirmed the cause. To recover:

  1. Stop your APM Server(s) so they are not writing any new documents
  2. Delete your existing apm-* indices either with DELETE apm-* in dev console or via the stack management UI, which looks like this:
  3. Start APM Server and ensure template setup is enabled - it's on by default, so make sure you don't have setup.template.enabled: false in your APM Server config (usually apm-server.yml)
  4. Verify the correct index templates were installed. That's either GET _template/apm-* in dev console or again via stack mangement UI, you're looking for their presence under "legacy index templates" like this:
1 Like

i did all those steps which you have included above but still i can't get any service name in apm GUI ,


here is also yml file scrnshot:

but still i am facing this issue

Hi @jorsec

Can you elaborate a bit on this part please :

To be a bit more specific:

  • Just to be sure, are you using Elastic agent or Elastic APM Java agent ?.
  • how is the Java agent configured ? Can you provide it's configuration (with credentials removed) ?
  • is there any error/warning in the Java agent log output ?
  • can you [capture agent debug logs] ?(Troubleshooting | APM Java Agent Reference [1.x] | Elastic)
  • the Java agent does not send application logs by default, however metrics are sent when the java agent starts, do you have any document created in the metrics-* indices ? Once metrics are sent the service becomes visible in Kibana.

Also, it might be worth checking our troubleshooting documentation if you haven't already.

Hi @Sylvain_Juge thanks for the respose, currenlty i am using elastic apm java agent with this configuration in tomcat:

export CATALINA_OPTS="$CATALINA_OPTS -javaagent:/opt/apmagent/elastic-apm-agent-1.27.0.jar"
export CATALINA_OPTS="$CATALINA_OPTS -Delastic.apm.service_name=zan"
export CATALINA_OPTS="$CATALINA_OPTS -Delastic.apm.application_packages=com.example.zan"
export CATALINA_OPTS="$CATALINA_OPTS -Delastic.apm.server_url=http://hostname:8200"

when i start the tomcat server, it's get connected to apm server without throwing any errors on catalina.out

i have metrics-* indices created but i dont have any metrics-* while verifying it throught the discover tab:

Thanks ,

Disclamer: I'm not an expert about the index patterns used for APM.

With a recent stack deployment (7.15.2), the APM metrics do not seem to be readable in the metrics-* index pattern, can you try with the following ?
traces-apm*,logs-apm*,metrics-apm*,apm-*

Normally this index pattern should have been automatically created for you on deployment.

hi @Sylvain_Juge , as this indices are created by default , while i check the apm indices:


image

and those indices are also pointed to apm-*, but i cant figure it out why it is not showing any service name in apm GUI

Thanks,

Hi @Sylvain_Juge & @gil ,

Any updates from your side , what i need to do to solve this issue.

Thanks,

You said you can see the "logs" in Discover
What happens when you simply go to Discover
Index Pattern apm-*
KQL bar

service.name:*

Do you see entries?

what about this

service.name : * and processor.event : "transaction"

I also noticed that you had very few documents in apm-transaction-7.13.1-000001 so make sure your time range is set correctly to contain the events BTW services will not show up in the APM UI if they are not within the specified time range.

Hello @stephenb ,
when i used this index pattern apm-* and service.name:* and processor.event : "transaction" in KQL bar i can see all their respective results,

but when i go to apm interface i cant get any servicename and their respective results.

Regarding the documents again i have delete those old documents, and again restarted the server but even cant see any service name in apm interface.

The fact there are still all those .keyword field means to me you are still not setup correctly they should not be there.

Also when you say you see all them what are the service.name

I have a problem like you, APM UI on kibana show "No service found" but discover menu have log metric agent. How can I fix this problem ?

Elastic version 7.15.1
Kibana version 7.15.1
APM Server version 7.15.1

GET apm-*/_mapping/field/service.name

`{
  "apm-7.15.1-onboarding-2021.12.02" : {
    "mappings" : { }
  },
  "apm-7.15.1-profile-000001" : {
    "mappings" : { }
  },
  "apm-7.15.1-metric-000001" : {
    "mappings" : {
      "service.name" : {
        "full_name" : "service.name",
        "mapping" : {
          "name" : {
            "type" : "text",
            "fields" : {
              "keyword" : {
                "type" : "keyword",
                "ignore_above" : 256
              }
            }
          }
        }
      }
    }
  },
  "apm-7.15.1-span-000001" : {
    "mappings" : {
      "service.name" : {
        "full_name" : "service.name",
        "mapping" : {
          "name" : {
            "type" : "text",
            "fields" : {
              "keyword" : {
                "type" : "keyword",
                "ignore_above" : 256
              }
            }
          }
        }
      }
    }
  },
  "apm-7.15.1-error-000001" : {
    "mappings" : {
      "service.name" : {
        "full_name" : "service.name",
        "mapping" : {
          "name" : {
            "type" : "text",
            "fields" : {
              "keyword" : {
                "type" : "keyword",
                "ignore_above" : 256
              }
            }
          }
        }
      }
    }
  },
  "apm-7.15.1-transaction-000001" : {
    "mappings" : {
      "service.name" : {
        "full_name" : "service.name",
        "mapping" : {
          "name" : {
            "type" : "text",
            "fields" : {
              "keyword" : {
                "type" : "keyword",
                "ignore_above" : 256
              }
            }
          }
        }
      }
    }
  }
}
`

Now I can solved this problem
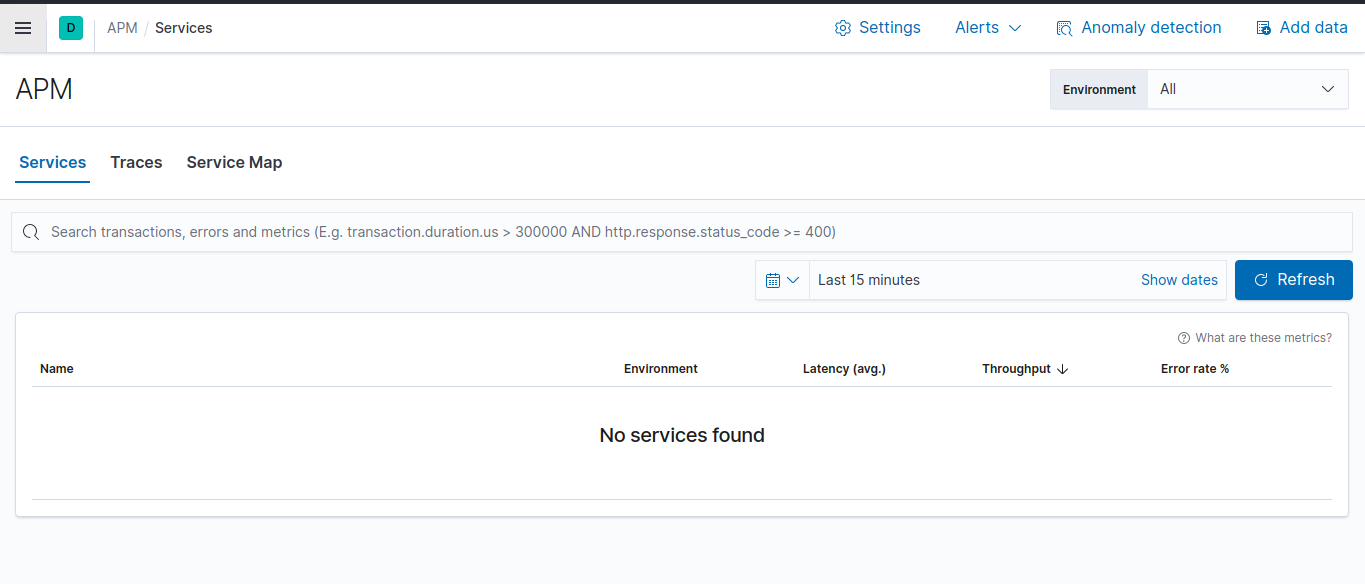
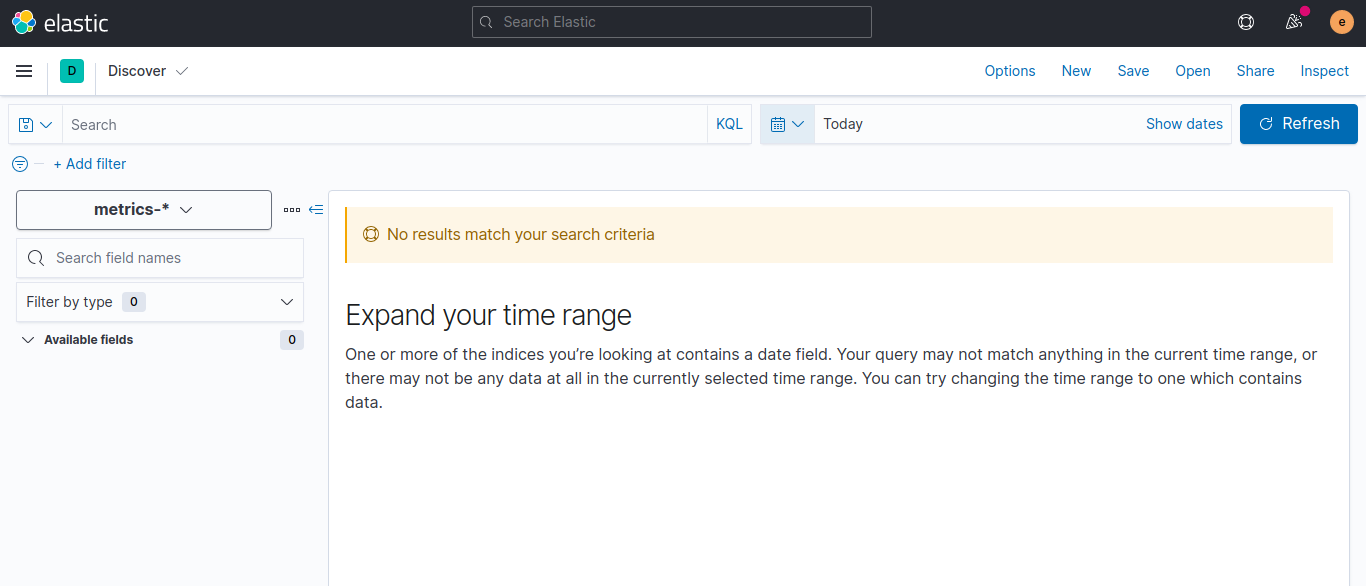
index name “apm-7.15.1-onboarding-2021.12.02” and “apm-7.15.1-profile-000001” not have mapping field “service.name”. I check index setting for index name “apm-7.15.1-onboarding-2021.12.02” and “apm-7.15.1-profile-000001” on Kibana Dev Tools menu with

GET apm-7.15.1-onboarding-2021.12.02/_settings
GET apm-7.15.1-profile-000001/_settings

I found index name “apm-7.15.1-onboarding-2021.12.02” and “apm-7.15.1-profile-000001” not use index template name apm-7.15.1 (this template default by Elastic). Usually index setting "index.mapping.total_fields.limit" default = 1000 but index name “apm-7.15.1-onboarding-2021.12.02” and “apm-7.15.1-profile-000001” have total field over 1000 fields.

so another index template if you not setting
"index.mapping.total_fields.limit" your index template use default = 1000. if using index template: apm-7.15.1, it is set "index.mapping.total_fields.limit": 2000
After understanding this problem I solved it by this step

  1. Stop apm server
  2. Delete index apm-* on Dev Tools menu with

DELETE apm-*

  1. Unset index_template for index name: apm-*
    (index name apm-* must use default index_template name: apm-7.15.1)
  2. Start apm server
  3. Check index setting use template: apm-* on Kibana Dev Tools menu with

GET apm-7.15.1-onboarding-2021.12.02/_settings

GET apm-7.15.1-profile-000001/_settings

after checked index name “apm-7.15.1-onboarding-2021.12.02” and “apm-7.15.1-profile-000001” have index mapping “index.mapping.total_fields.limit”: 2000

  1. Check mapping field all index name apm-* have field service.name

GET apm-*/_mapping/field/service.name

{
  "apm-7.15.1-onboarding-2021.12.02" : {
    "mappings" : {
      "service.name" : {
        "full_name" : "service.name",
        "mapping" : {
          "name" : {
            "type" : "keyword",
            "ignore_above" : 1024
          }
        }
      }
    }
  },
  "apm-7.15.1-profile-000001" : {
    "mappings" : {
      "service.name" : {
        "full_name" : "service.name",
        "mapping" : {
          "name" : {
            "type" : "keyword",
            "ignore_above" : 1024
          }
        }
      }
    }
  },
  "apm-7.15.1-span-000001" : {
    "mappings" : {
      "service.name" : {
        "full_name" : "service.name",
        "mapping" : {
          "name" : {
            "type" : "keyword",
            "ignore_above" : 1024
          }
        }
      }
    }
  },
  "apm-7.15.1-metric-000001" : {
    "mappings" : {
      "service.name" : {
        "full_name" : "service.name",
        "mapping" : {
          "name" : {
            "type" : "keyword",
            "ignore_above" : 1024
          }
        }
      }
    }
  },
  "apm-7.15.1-error-000001" : {
    "mappings" : {
      "service.name" : {
        "full_name" : "service.name",
        "mapping" : {
          "name" : {
            "type" : "keyword",
            "ignore_above" : 1024
          }
        }
      }
    }
  },
  "apm-7.15.1-transaction-000001" : {
    "mappings" : {
      "service.name" : {
        "full_name" : "service.name",
        "mapping" : {
          "name" : {
            "type" : "keyword",
            "ignore_above" : 1024
          }
        }
      }
    }
  }
}

This topic was automatically closed 20 days after the last reply. New replies are no longer allowed.