We have some data which displays a low hourly average when viewed across say 30 days but when you zoom in to a few days the average jumps up which is wrong: I can't show a 20s average and then, when I zoom in show a 75s average...
The data points exist for every 5min.
Zoomed Out (Oct 7-22) - timestamp buckets are per hour:

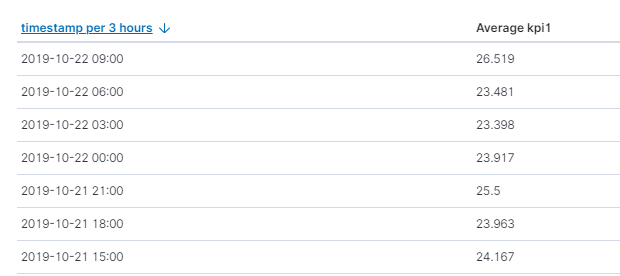
Zoomed In (Oct 13-22) - timestamp buckets are per 3 hours:


Am I just bad at stats or is this a bug?
Also, I've set it to show hourly but it wants to show 3h - how can I change this? The UI suggests we can have custom values:
Select an option or create a custom value. Examples: 30s, 20m, 24h, 2d, 1w, 1M
