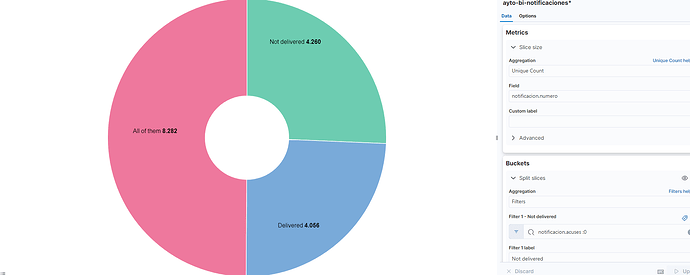
Hi. First time posting here, I'm also quite newbie working with ELK so plz be patient.
We are studying how to build some dashboards across an index where we are storing historical data of our notification system.
Each time any notification changes status we store a new document on our index, and every notification has a unique identifier which allow us to identify that different documents refers to the same notification.
Now... this index is perfect to study with great detail problems within specific time ranges, or within specific notifications, as we can see the complete road it followed, which fields changed, when, what values there were before, etc...
It's also a great option to create dashboards with graphs where we show the evolution in time of a metric or a value.
But we are struggling when we want to create graphs that uses aggregation, because when we got several documents for each notification on the time frame we are querying, we don't know which of the records is being aggregated.
For example, imagine we want to create a graph that shows how many notifications we have pending and how many we have succesfully delivered in a time frame, so we aggregate by status value.
If I have several different documents of notification 'X' in my time frame, some of them with 'pending' state and some with 'delivered' state, I will get several hits in each aggregated value, and if I ask my graph to use a unique count, I won't be able to know which of the valid documents is being accounted for, so I don't really know if my 'X' notification is being accounted as 'pending' or as 'delivered', as on this time frame I have both values.
This seems like something that we could fix using a second index. We can use a first index with historical data, and another one were we record just the last state (more like a relational database). This way, we could use the historical index to create dashboards and graphs that explore time distributed info, and another index just to get info about 'current' state of affairs on our notification system.
The problem here, is that although this approach would be valid to get our 'status graph' with current info, we lose the ability to query that graph to ask it how many delivered and pending notifications we have past month, or past year, as when I update a notification I lose it's previous info.
If notification 'X' is delivered today and was pending all over the last month, if I query the graph in a time frame of the last month it won't be accounted for, as there won't be any record for notification 'X' referred to last month (as it was updated today).
So... our still relational thinking minds are trying to realize how (if it's possible) would we be able to query our historical index in a time frame, but when making a unique count of elements, be able to force the graph to get the last document of each notification.
Something deep inside me is shouting that we are trying to use a big data approach to a relational problem. But in the end, we aren't trying to do anything so strange, I'm quite sure that must have a correct way to achieve what we are trying to do, just we don't realize, neither find, how to do it.
Any insight on this topic will be much appreciated. Sorry if I express myself a bit clunkily, as english is not my mother language.
